Same brief, two toolchains — heat-metrics-lab vs heat-protein-lab
Two days ago I shipped heat-protein-lab — a nine-chapter scrollytelling explainer about what heat does to proteins in the body, built using Antigravity 2.0, Stitch MCP, and Google DeepMind’s Science Skills bundle. Then I immediately started building heat-metrics-lab — same artifact class, same deploy target, covering air temperature vs heat index vs WBGT — but using Claude Code and the Anthropic skill ecosystem exclusively, no Google tooling of any kind.
Both builds are done. This post is the comparison. It’s not a verdict: both sides produced a real site, both sides had real wins.
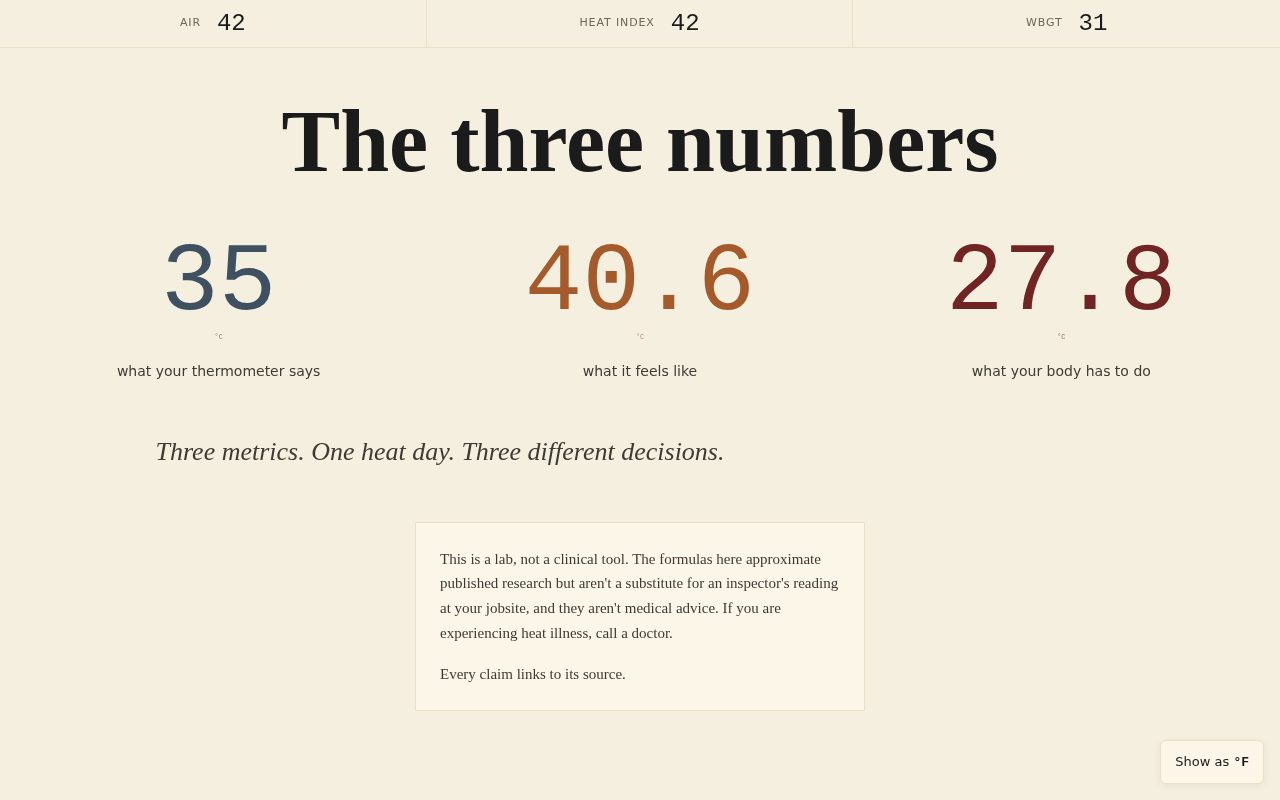 The opening of heat-metrics-lab. Three numbers — air temperature, heat index, WBGT — pre-populated with the canonical opening reading (35 °C / 40.6 °C / 27.8 °C). One day. Three different decisions, depending on which number the inspector reads.
What I set out to compare
The brief for both projects was identical: build a citation-grounded scientific explainer, with structured figures, readable on mobile, deployed to Cloudflare Pages, written by one person with AI tooling as the primary co-author. The controlled variable was the toolchain — everything else held constant so the toolchain differences would be visible.
I kept a running DEVREL.md in heat-metrics-lab that logged per-phase findings as they happened. Session-report telemetry from Task 6.4 gives the quantitative spine.
What heat-protein-lab used
Three Google products composed together.
Antigravity 2.0 is the agentic IDE that replaces the Gemini CLI on 2026-06-18. I used the desktop IDE for most chapter work and agy --print mode from the Pi for data-fetch and verification tasks. The desktop IDE’s strongest feature is visibility: every tool call — file reads, file writes, shell commands, MCP invocations — is shown as it happens and the operator can pause and edit between. That transparency was the biggest ergonomic difference from any terminal-only setup.
Google DeepMind Science Skills is seventeen Python CLIs covering RCSB PDB, AlphaFold, PubMed, Human Protein Atlas, ClinVar, Reactome, and more. Six of the seventeen got used heavily. They’re deterministic, uv-runnable, and return structured JSON. The pdb_database skill caught two wrong PDB candidates in my own design document before any rendering code was written. That kind of metadata-first verification step is hard to replicate without structured domain data at your fingertips.
Stitch ships as an MCP inside Antigravity 2.0. I used it to mock chapter layouts before writing the CSS. Nine chapter mockups from a single prompt via Python threading in under two minutes was a real convenience — the result was a reference set I could iterate against without re-prompting per chapter.
What heat-protein-lab did not have: any structured pre-implementation review of whether its formulas were correct, or any structured critique of whether its visualization choices were making the argument they intended to make.
What heat-metrics-lab used
The Anthropic-side stack was deeper and more varied:
superpowers:subagent-driven-development was the dispatch mechanism for all parallel chapter work. Thirteen implementer dispatches across Phases 1 through 5 (labeled Dispatch A through M in DEVREL.md). Each dispatch ran a Sonnet-class implementer with a fully-specified prompt; a Haiku reviewer checked the output for spec compliance. The full dispatch ceremony — spec, implementer, reviewer, fix-pass if needed — is a pattern with real overhead but it caught issues that would otherwise have slipped.
advisor is an in-session code reviewer backed by a stronger model. It sees your full conversation history and can reason about what you’re about to build before you build it. In Phase 1 it caught the WBGT formula bug — covered in detail in its own post.
tufte-viz is a community skill (aparente’s gist, installed manually via notes/devrel/install-tufte-viz.sh) that applies Edward Tufte’s visualization principles — data-ink ratio, eraser test, collision test, the 7-question Tufte test — as a structured critique pass. It ran on every chart in Phases 3 through 5. In Phase 4 it caught the divergence-map normalization bug — covered in detail in its own post.
playground scaffolded the Ch 4 scenario flipper and the Ch 7 sandbox using its single-state-object + preset-chips pattern. That pattern — all state in one object, preset chips as named snapshots of that object, localStorage for persistence — is exactly the right shape for an exploratory scientific UI. It reduces the surface area for bugs by an order of magnitude compared to ad-hoc state.
frontend-design handled visual polish passes and component styling. The four SVG diagrams — Stevenson screen, NWS heat-index nomogram, three-thermometer rig, NIOSH work-rest table — were all produced with tufte-viz critique passes embedded in the dispatch prompt.
session-report generated the quantitative build telemetry at the end of the build. That’s the data in §7 below. heat-protein-lab had no equivalent.
Where the Anthropic side was stronger
Two findings stand out as unambiguous.
The WBGT formula bug. Phase 1’s plan described an outdoor-WBGT formula: Tg = Ta + 0.0345 * S / wind_ms^0.4, characterized as “matches Liljegren 2008 within ~1 °C.” Before any implementer touched that formula, the advisor ran a sanity check against five published Liljegren reference cases. The result: RMSE 6.68 °F, not the claimed 1 °C. The formula produced WBGT readings 3–7 °F too high. A 30-minute tuning pass replaced it with Tg = Ta + 0.0125 * S / wind_ms^0.3 (RMSE 1.37 °F). The plan was amended in commit 9ccb9e7 before any implementer saw it.
That pre-implementation catch is hard to overstate. A 3–7 °F WBGT overestimate in an occupational heat safety explainer isn’t a rounding error; it’s a meaningful misrepresentation of when conditions become dangerous. The Google-side build had no equivalent gate. Heat-protein-lab’s formulas were either lookup-table values from Science Skills databases (where correctness is the database’s job) or matplotlib plotting code reviewed visually. There was no moment equivalent to “let me verify this formula against published reference cases before the code ships.”
The divergence-map normalization bug. Phase 4’s Ch 5 divergence map was designed to show where WBGT and heat index give different severity signals. Under the original threshold-relative normalization, WBGT “won” only 2 out of 1,140 outdoor grid cells and 0 out of 1,140 indoor cells. Heat index’s much larger ceiling (~60 °C vs WBGT’s ~35 °C) meant HI’s threshold-relative breach was always larger, everywhere.
The tufte-viz critique pass during Dispatch K surfaced this. The implementer’s structured eraser-test and 7-question Tufte walk identified that the map looked right — colored cells, divergence shown — but was failing to make the chapter’s actual argument. The implementer rewrote the Ch 5 prose to honestly describe what the map showed (HI-dominant everywhere) rather than asserting the spec’s intended divergence story. That honesty surfaced the design flaw rather than burying it. The fix (commit 8c9da92) renormalized by each metric’s dynamic range above threshold; the corrected distribution was outdoor WBGT 8.9% (a meaningful band) and indoor WBGT 0% (which is itself a real finding: WBGT earns its keep outdoors, where solar load matters). Ch 5 prose was rewritten again at 63abfb9 to match.
Without the structured critique pass, that map would have shipped silently. It would have rendered something plausible but made the wrong argument.
Two other Anthropic-side wins worth naming, though not as dramatic:
The session-report skill gave this build a quantitative spine that heat-protein-lab simply didn’t have. I can tell you exactly how many tokens each dispatch cost, what the cache-hit rate was (96.5%), how the top prompt distribution broke down. That’s useful for my own tuning and for anyone replicating this pattern.
The playground skill’s single-state-object pattern for the Ch 4 flipper and Ch 7 sandbox produced significantly cleaner interactive code than heat-protein-lab’s equivalent chapters, which were more ad-hoc. It’s not dramatic, but it’s consistent.
Where the Anthropic side was harder or weaker
Honest account.
Plugin install friction. Both ecosystems require operator-side plugin installs for community skills, and neither handles that cleanly from inside an agent. On the Anthropic side, /plugin install scrollytelling@doodledood never resolved — the marketplace name didn’t match (the correct form turned out to be scrollytelling@claude-code-plugins-marketplace). The skill ended up unused; I ported heat-protein-lab’s hand-rolled IntersectionObserver pattern instead. The tufte-viz skill required cloning four files from a gist manually via a shell script. Both sides require operator action for one-time setup; but a documented skill failing to install by name is a friction point Google’s panel didn’t produce in an equivalent way.
No Science Skills equivalent for domain data. This is the clearest Google win. Heat-protein-lab’s data layer was structured domain data fetched from PDB, AlphaFold, HPA, ClinVar, Reactome — authoritative databases, deterministic outputs, rich metadata that caught errors in the design document before code ran. Heat-metrics-lab’s data layer was Python scripts hitting NOAA/NWS directly and hand-curating scenario values. The NOAA data is real, but the fetching and formatting was entirely manual. For any scientific explainer in a domain with structured databases (genomics, atmospheric science, chemistry), Science Skills-style CLIs are a meaningful leg up. There is no Anthropic-ecosystem equivalent today.
The subagent-stops-before-commit pattern. Phase 3’s Dispatch G (the three matplotlib diagrams) produced scripts/04_render_diagrams.py and the three SVGs on disk, but the implementer hit a thinking budget and stopped before committing. The artifacts were correct; they just needed a controller commit pass to land on main. I finished the commit pass manually, putting the applied Tufte principle in each commit message (f59c370, 096d198, fc88d8c). This is recoverable — the cost is one controller action, not a redo — but it adds overhead. A pattern where the implementer always finishes with a commit or explicitly surfaces “I’m stopping here because X” would reduce this.
Browser-test deferral, recovered. The a11y audit (Task 6.2) and viewport regression baseline (Task 6.3) were designed to run via claude-in-chrome in-browser. No Chrome was connected during the main build, so both were initially deferred to operator. When a browser became available later, I switched to Playwright headless (the operator already had Chromium 1223 installed at ~/.cache/ms-playwright/chromium_headless_shell-1223/chrome-linux/headless_shell) and the audit ran cleanly — found one real WCAG AA failure (strip labels at 3.31:1) and one structural gap (no skip link), both fixed in commit 8d21eb6. The lesson is less about tooling capability than about the friction of “browser session must exist” as a soft prerequisite for in-browser checks.
The shared infrastructure
Both builds used Cloudflare Pages for deploy, vanilla HTML/CSS/JS with no bundler, matplotlib figures rendered to SVG at build time and committed to data/, and the same “no runtime analytics, no PII, no accounts” constraint. The shared infrastructure was deliberate — it removes bundler behavior and framework conventions as confounders and lets the comparison focus on authoring experience and output quality.
One small difference: heat-metrics-lab dropped its GitHub Actions deploy workflow mid-build at commit 110888d in favor of local npx wrangler pages deploy. Removes a deferred secrets-management problem; deploys become a deliberate operator action.
The numbers
Session-report telemetry from Task 6.4. Note on methodology: both builds ran on the same Pi under the same -home-craigm26 project-transcript directory. The heat-protein-lab bucket is by-day for 2026-05-25 and includes ~5% other short sessions that weren’t HPL; treat HPL numbers as directional, not exact.
| Metric | heat-protein-lab | heat-metrics-lab | Note |
|---|---|---|---|
| Total tokens (input + output) | ~483.6M | 180.8M | HML was 2.7× cheaper |
| Cache-hit rate | ~97% (3-day combined) | 96.5% | Both well above 85% healthy threshold |
| Sessions | 6 | 10 | HPL had fewer but larger sessions |
| API calls | — | 1,822 | HML only; HPL sessions not isolated |
| Subagent calls | ~132 (derived) | 63 calls, avg 1.17M/call | HPL’s worktrees drove more spawns; HML’s dispatch chains were larger per call |
| Top skill (HML) | using-git-worktrees | subagent-driven-development (43.2M, 24% of input) | Worktrees vs dispatch = the primary architectural cost difference |
| Formula bug caught pre-ship | No | Yes — 3–7 °F overshoot | Strong Anthropic-side win |
| Visualization bug caught pre-ship | No | Yes — normalization flaw (Ph 4) | Strong Anthropic-side win |
The 2.7× efficiency gap is not primarily a quality difference. Both builds landed a 9-chapter scrollytelling site with matplotlib figures and an interactive centerpiece. The architectural driver: heat-protein-lab used superpowers:using-git-worktrees for isolation (32.7M tokens for that skill alone), while heat-metrics-lab used dispatch-based subagent isolation, which is cheaper per unit of parallel work on a single-machine build. If I ran HPL again with dispatch-based isolation instead of worktrees, I’d expect the token count to drop substantially.
Both builds were also dominated by single-action continuation prompts that launched enormous execution chains: HPL’s top prompt was “Proceed.” (94.7M tokens, 11.2% of the 3-day combined total); HML’s was “1” (54.2M tokens, 30% of HML total). The concentration of spend around single-word operator confirmations is a pattern worth noting for both ecosystems.
Closing
Both builds produced the same class of artifact. The two unambiguous Anthropic wins — the WBGT formula catch and the divergence-map normalization catch — both happened because heat-metrics-lab was rolling its own formulas and encoding its own data layer. When you’re computing from scratch, a pre-implementation sanity check matters more than when you’re pulling from authoritative databases. Heat-protein-lab’s Science Skills databases offloaded the “is this scientifically correct” check to RCSB, AlphaFold, and HPA. Both are valid approaches; they just change where the correctness burden lives.
The unambiguous Google win is Science Skills. There is no Anthropic-ecosystem equivalent for structured, deterministic, citation-grounded domain data as a one-command CLI. If I were building heat-protein-lab in Claude Code, I’d be writing the same NCBI and PDB HTTP calls by hand.
The 2.7× token efficiency gap surprised me. It’s likely architecture-driven — HPL’s worktrees-based isolation spent 32.7M tokens on that pattern alone — but it’s a real number worth tracking for anyone choosing between toolchains with a token budget in mind.
Both sites are live, MIT-licensed, and open repos.
heat-metrics-lab is at https://heat-metrics-lab.pages.dev/. heat-protein-lab is at https://heat-protein-lab.pages.dev/. Repo for this post: github.com/craigm26/heat-metrics-lab.
This post is one of four in the heat-metrics-lab series:
- Heat Metrics Lab is live — air temperature, heat index, WBGT, and why three numbers matter — the project announcement.
- A 0.5 °F drift gate, and the advisor that caught the formula bug before it shipped — Phase 1 deep-dive.
- When a chart-critique skill catches a design bug before ship — Phase 4 deep-dive.
- This post.