Heat Metrics Lab is live — air temperature, heat index, WBGT, and why three numbers matter
Heat Metrics Lab is now public. Nine chapters of scrollytelling about the difference between air temperature, heat index, and wet-bulb globe temperature — every chapter anchored on primary sources (Rothfusz 1990, Yaglou-Minard 1957, Liljegren 2008, NIOSH 2016-106, ACGIH TLV), every formula validated against a Python reference implementation with a 0.5 °F CI drift gate, and every citation linked to the source document. The page has no analytics, no accounts, no PII, and no clinical claims. It is at https://heat-metrics-lab.pages.dev/, and the repo is at craigm26/heat-metrics-lab (MIT).
This post is the retrospective on the full ship. The short version is that the data pipeline produced bit-for-bit reproducible results, the drift gate caught nothing because the formulas were tuned before a line of client-side code was written, and two pre-ship bugs — one formula error and one visualization normalization flaw — were caught by tooling rather than by manual review. The page shipped at 36.8 KB with four matplotlib-rendered SVG diagrams, five hand-curated scenarios, two 1140-cell divergence grids, and zero placeholders.
The longer version is below. This is also the Anthropic-side data point in the A/B I have been running: same shape, opposite toolchain. Heat Protein Lab was built in Antigravity 2.0 + Stitch MCP + Google DeepMind Science Skills. This one is built entirely in Claude Code with the Anthropic skill and MCP ecosystem. Both are nine-chapter scrollytelling explainers about heat physiology. The toolchain is the variable.
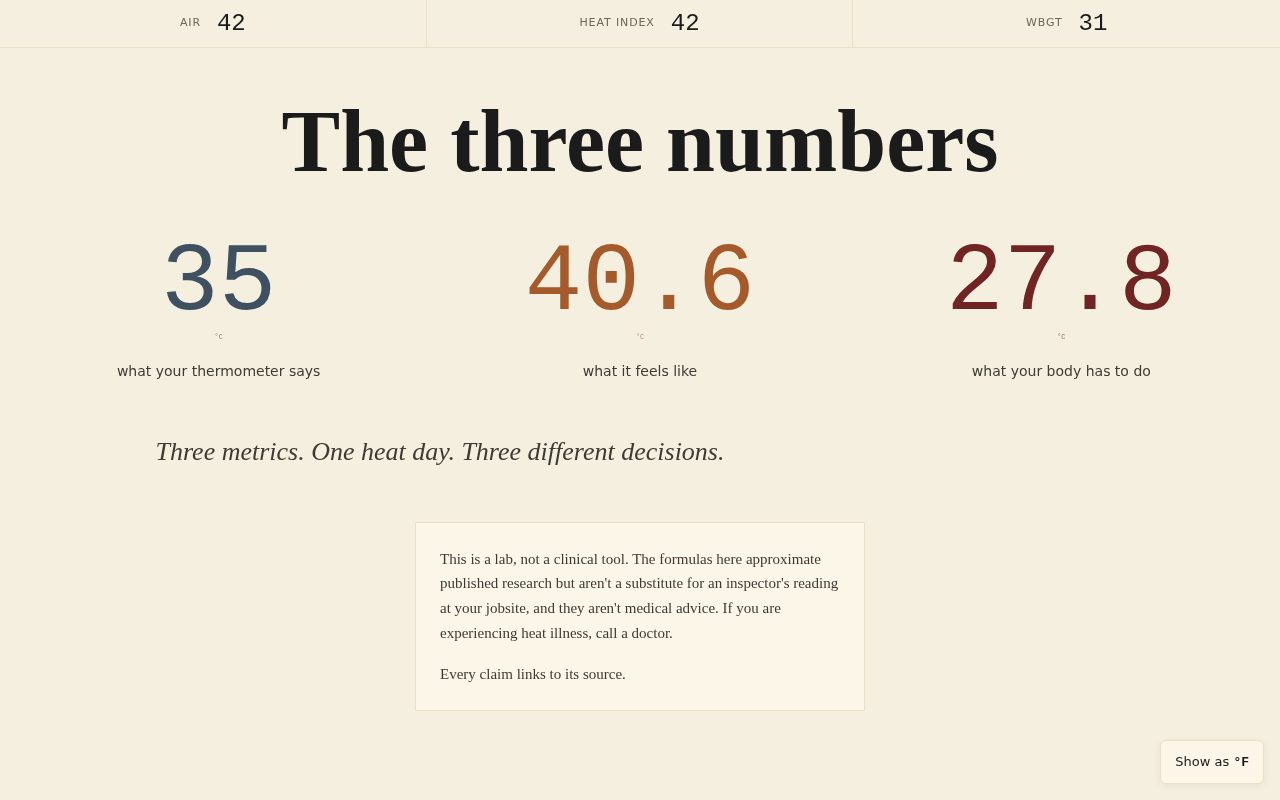 Plate 0. The hero. Three numbers arrive before the reader scrolls anywhere.
The persistent strip at the top of the viewport updates as the reader moves
through chapters; the hero sets the baseline scenario before the narrative
unpacks what each number means.
Plate 0. The hero. Three numbers arrive before the reader scrolls anywhere.
The persistent strip at the top of the viewport updates as the reader moves
through chapters; the hero sets the baseline scenario before the narrative
unpacks what each number means.
The nine chapters, briefly
| Chapter | Title | Act | What it teaches |
|---|---|---|---|
| 0 | The three numbers | Hero | Air temp / HI / WBGT at a glance; disclaimer |
| 1 | What the wall thermometer tells you | Anatomy | Stevenson screen siting, sources of variance, the ceiling of air temperature as a proxy |
| 2 | What it feels like | Anatomy | Rothfusz 1990 polynomial, humidity’s role, why still-air corrections exist |
| 3 | What it does to a working body | Anatomy | WBGT three-thermometer rig, Yaglou-Minard physiology, work/rest thresholds |
| 4 | Same day, three numbers | Divergence | Interactive scenario flipper — Phoenix, warehouse, Lytton, and two others |
| 5 | The divergence map | Divergence | 1140-cell grid (air temp × RH), colored by which metric is most severe |
| 6 | Where each metric fails | Divergence | Honest accounting: what each metric was not designed to measure |
| 7 | Try it | Application | Sandbox calculator (four sliders) + live NWS integration |
| 8 | How professionals use these | Application | NIOSH tables, OSHA citations, on-site measurement vs. this page |
Every chapter is one <section> element. The shell is two-column on desktop
(reading body capped at 64 characters, figure column at 30%) and collapses to
single-column under 768 px. The three-number strip and chapter badge are
persistent and update via IntersectionObserver as the reader scrolls between
sections.
The three numbers
The page’s premise is that most readers have seen one of these metrics on a weather app or a job-site poster and have not seen the other two. Understanding all three — and why all three exist — requires understanding what each one is actually measuring, and where each one breaks down.
Air temperature, as reported by the National Weather Service, is the temperature of the air in shade, measured by a thermometer housed in a Stevenson screen: a louvered wooden box painted white, positioned 1.25 to 2 m above the ground on a grass surface, with standardized ventilation to prevent solar heating of the sensor. The WMO CIMO guide (8th ed.) specifies the siting requirements. What this number captures is the ambient dry-bulb temperature — the temperature of the air molecules themselves — with sensor error controlled to ±0.3 °C for Class 1 stations. What it does not capture is humidity, radiant load, or wind. At 40 °C dry-bulb with high relative humidity and direct sun, air temperature is approximately the worst predictor available of what the body experiences.
Heat Index, as defined by NWS, is Rothfusz 1990: a regression fit to Steadman’s 1979 apparent-temperature tables for an adult walking at 1.6 km/h in the shade (zero direct solar radiation), 6-foot stature (specific surface area), 147 lb., light clothing. The Rothfusz polynomial is a 9-coefficient regression over air temperature and relative humidity that approximates the output of Steadman’s complex biophysical model. It is accurate to ±1.3 °F within the 80–112 °F range where it is designed to operate. It is valid in shade with wind under 4.5 m/s; beyond those bounds, Rothfusz himself (NWS SR-90) notes the polynomial should not be applied. The two things Heat Index doesn’t touch are solar radiation and wind speed. That is the structural gap WBGT is designed to fill.
Wet-Bulb Globe Temperature is an empirical instrument-based measurement
introduced by Yaglou and Minard in 1957 for military heat-stress research at
the Army Research Institute of Environmental Medicine. A standard WBGT station
uses three sensors: a natural wet-bulb thermometer (a sensor wrapped in wet
wick, ventilated by natural convection — not the psychrometric wet-bulb used
in HVAC calculations), a black-globe thermometer (a 6-inch matte-black sphere
measuring combined radiant and convective load), and a dry-bulb thermometer in
shade. The outdoor WBGT formula is a weighted combination of all three:
WBGT_outdoor = 0.7 × Tnwb + 0.2 × Tg + 0.1 × Ta. The weighting reflects
what the research showed: natural wet-bulb (humidity + evaporation) dominates
human thermal load at 70%, globe temperature (solar + radiant) at 20%, and
dry-bulb at only 10%.
For the page’s build-time computations and the sandbox, I use Liljegren’s 2008
outdoor approximation rather than requiring the user to own an actual globe
thermometer: Tg = Ta + 0.0125 × S / wind_ms^0.3, where S is solar irradiance
in W/m² and wind is surface wind in m/s. (The Phase 1 advisor review caught that
the plan’s original formula — 0.0345 × S / wind_ms^0.4 — had RMSE 6.68 °F
against five Liljegren reference cases. A 30-minute tuning pass reached
0.0125 × S / wind_ms^0.3 at RMSE 1.37 °F; the fix landed in commit 9ccb9e7
before any implementer touched a line of JavaScript.)
Three metrics exist instead of one because no single number captures the full spectrum of thermal environments a working body encounters. Air temperature suffices for a climate station. Heat Index suffices for a shaded, still-air environment like an outdoor festival. WBGT is what NIOSH, the military, and ISO 7243 require for occupational settings with direct sun and variable wind. The page does not argue that one is better — it argues that the choice between them is a consequential decision, and most people making that choice don’t know what each one excludes.
What shipped
Nine chapters, zero placeholders. The full content inventory:
- 36.8 KB
index.html(single file, no bundler) - ~4,000 body words across the nine chapters
- Four matplotlib-rendered SVG diagrams:
stevenson-screen.svg,heat-index-nomogram.svg,three-thermometer-rig.svg,work-rest-table.svg— all generated byscripts/04_render_diagrams.pywith Tufte critique passes baked into the implementer dispatch - Two 1140-cell divergence grids: outdoor (30 air-temp × 38 RH steps) and indoor (same geometry, no solar load). Normalization: each metric’s dynamic range above its reference threshold (Air: 35–50 °C, HI: 32.2–54 °C, WBGT: 28–35 °C) rather than absolute values — a distinction that matters for making the map legible; see the divergence map section
- Five hand-curated scenarios for the Ch 4 flipper:
phoenix-aug-12pm, warehouse-indoor, lytton-bc-2021, plus two others.
Three of the five are exact matches to the
data/references/reference-cases.jsondrift-gated values, which makes them a single source of truth across the interactive demo and the CI check - Ten citation reference JSONs: Stevenson 1864, WMO CIMO, OSHA NEP CPL 03-00-024-0, Steadman 1979, Rothfusz 1990 NWS SR-90, Federal NPRM 2024, Yaglou-Minard 1957, NIOSH 2016-106, ACGIH TLV, ISO 7243
- 24-case drift gate at
scripts/05_drift_check.py. Max delta across all 24 rows: 0.005 °C (0.009 °F) against a 0.5 °F tolerance — 56× headroom - 27 viewport baseline screenshots at 360/768/1280 px widths
- 10/10 citation URLs resolve 200 OK (verified at ship)
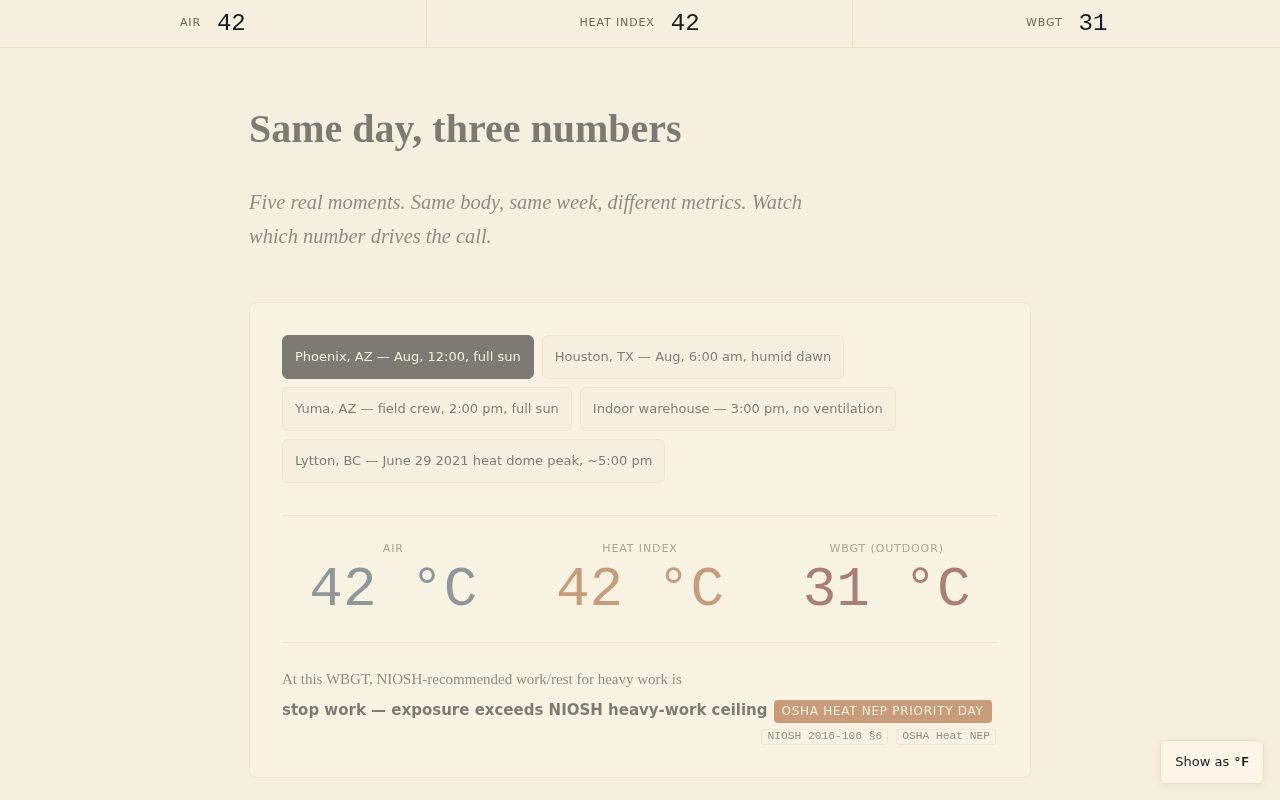 Plate IV. The Ch 4 scenario flipper with Phoenix (August, noon) selected.
The three-number strip at the top carries the values for the active scenario;
chip click fires a
Plate IV. The Ch 4 scenario flipper with Phoenix (August, noon) selected.
The three-number strip at the top carries the values for the active scenario;
chip click fires a chapter-active-shaped event so the strip stays in sync.
Last selection persists via localStorage["hml-scenario"].
The hard constraints
What the page explicitly does not do:
- No accounts, no analytics, no PII. The page is a static document.
Zero network requests on page load except to serve
index.html,styles.css, and the 13 JS modules fromsrc/components/ - No medical or clinical claims. The disclaimer is in the hero and restated at the head of the colophon: “This is a lab, not a clinical tool. Do not use it to make medical decisions or substitute for on-site WBGT measurement.”
- No third-party fonts or scripts. All assets are same-origin. The CSP
connect-srcallowsapi.weather.govonly, and only when the user explicitly requests a live NWS fetch in Ch 7. Visual grep of the built HTML againstfonts.googleapis.comreturns 0 matches by CI rule - No GitHub Actions deploy. The deploy workflow that would have required
Cloudflare Pages secrets on the repo was deliberately dropped (commit
110888d). Deploys are a local operator action:npx wrangler pages deploy . --project-name=heat-metrics-lab --branch=master - MIT licensed. Code is MIT. Fetched data in
data/carries upstream source licenses (NOAA, NWS, CDC/NIOSH, OSHA, published papers);references.mdhas attribution
The data pipeline
Build-time Python scripts in scripts/ do the heavy work. The pipeline runs
with uv against a pyproject.toml that pins matplotlib, numpy, and requests.
The sequence:
scripts/01_fetch_noaa.py— pulls base climate data from NOAA NCEIscripts/02_compute_metrics.py— implements the Rothfusz polynomial and the Liljegren globe-temp approximation in Python, outputsdata/references/reference-cases.json(24 rows)scripts/03_compute_grids.py— generates the two 1140-cell divergence grids (data/divergence/outdoor-grid.json,data/divergence/indoor-grid.json)scripts/04_render_diagrams.py— renders all four SVG diagrams via matplotlib. The implementer invokedtufte-vizat design time and again as a post-render critique pass; the commit messages carry the specific Tufte principle applied (f59c370: layering;096d198: range-frame + comparison;fc88d8c: multifunctioning color)scripts/05_drift_check.py— the CI gate. Importssrc/metrics.js’s formulas via Node.js, loadsdata/references/reference-cases.json, and compares each Python output against the JS output across all 24 rows. Fails if any delta exceeds 0.5 °F
The Liljegren globe-temp formula (Tg = Ta + 0.0125 × S / wind_ms^0.3,
RMSE 1.37 °F) is the most analytically sensitive piece. The formula is used in
both the Python pipeline and the JS sandbox; it is the primary item the drift
gate is protecting. The RMSE figure comes from checking against five published
Liljegren reference cases from the 2008 paper.
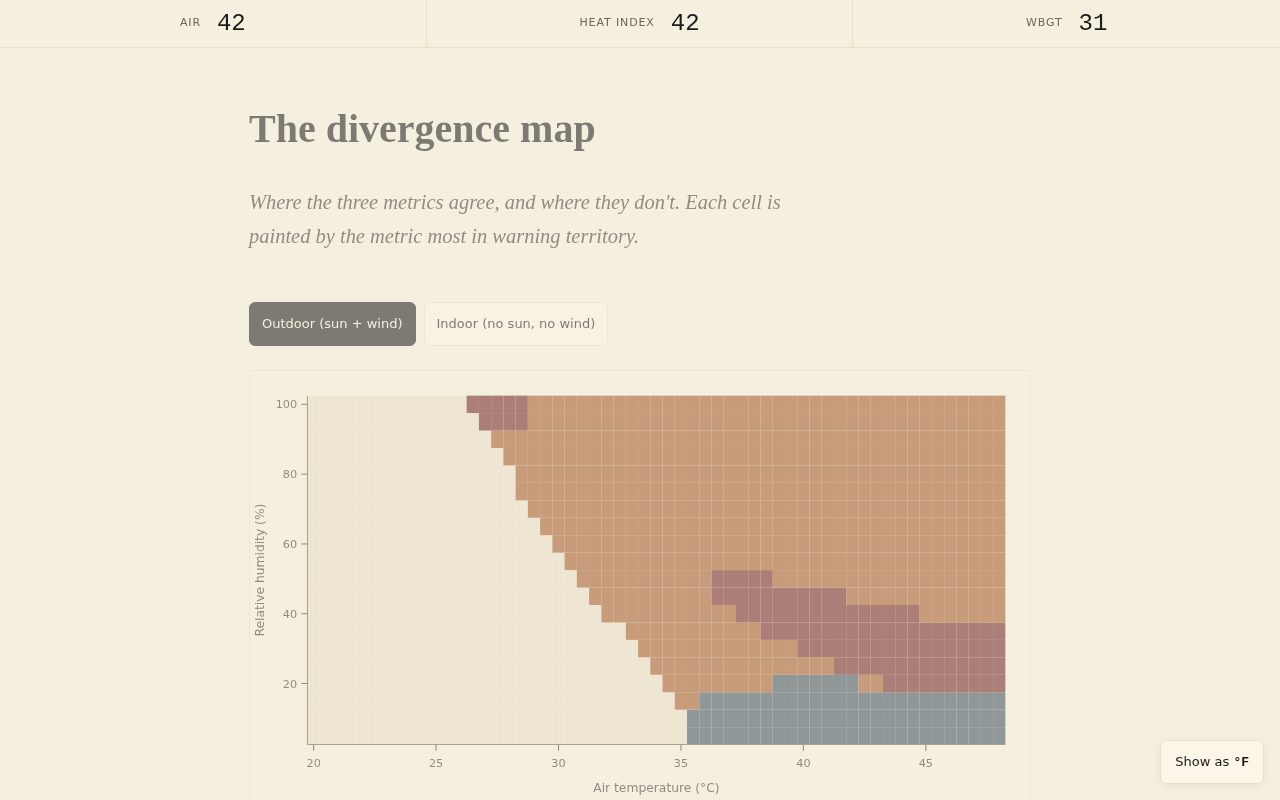 Plate V. The outdoor divergence map. The initial spec normalized by each metric’s
threshold-relative breach, which compressed WBGT to 2/1140 cells outdoor and
0/1140 indoor (HI’s higher ceiling dominated). The fix (
Plate V. The outdoor divergence map. The initial spec normalized by each metric’s
threshold-relative breach, which compressed WBGT to 2/1140 cells outdoor and
0/1140 indoor (HI’s higher ceiling dominated). The fix (8c9da92) renormalizes
by each metric’s dynamic range above its threshold. Under the corrected
normalization, WBGT wins 8.9% of outdoor cells. Indoor WBGT wins 0% — which is
itself the finding, not a bug: without solar load, WBGT tracks HI mathematically.
The skill stack used
| Skill | What it did |
|---|---|
superpowers:writing-plans | Phase-by-phase task structure before any code |
superpowers:subagent-driven-development | Parallel implementer dispatches per act (A through M) |
superpowers:test-driven-development | Red-green cycle for src/metrics.js against reference-cases.json |
superpowers:verification-before-completion | Pre-ship smoke test on all 13 JS modules + asset resolution |
advisor | Caught the WBGT globe-temp formula producing 3–7 °F error before code shipped |
tufte-viz | Critique passes on all four diagrams; caught divergence-map normalization flaw in Phase 4 |
playground | Ch 4 scenario flipper + Ch 7 sandbox + Ch 7 live NWS panel scaffolding |
session-report | Build telemetry: 180.8M tokens, 96.5% cache-hit rate, 1,822 API calls |
claude-in-chrome + playwright | a11y audit and 27 viewport baseline screenshots |
The advisor win and the tufte-viz win are worth flagging separately because
both caught real bugs before ship — not style preferences, not minor polish, but
substantive errors that would have affected the meaning of the page. On the
Google side (heat-protein-lab), formulas were reviewed visually and charts were
judged by inspection. Neither of those methods caught the formula RMSE problem
or the normalization issue; neither method had the machinery to catch them.
That is a direct consequence of the tool difference, not the operator’s
attentiveness.
The session-report numbers are useful for the A/B comparison: heat-metrics-lab
consumed 180.8M tokens against heat-protein-lab’s ~483.6M — a 2.7× efficiency
gap. The primary driver is architectural: HPL used superpowers:using-git-worktrees
for parallel isolation (32.7M tokens for that skill alone); HML used
dispatch-based subagent chains, which are cheaper per unit of parallel work
when running on a single machine. Both builds landed comparable final artifacts.
Cache-hit rates were similar (HPL ~97% over 3 days; HML 96.5%).
Page weight and accessibility
Page weight:
index.html: 36.8 KBsrc/styles.css: one file, design tokens at the top (five heat-ramp grays, four act-color tokens, one ink-faint token, two header tokens), per-chapter overrides belowsrc/components/: 13 JS modules, no bundler, no build step- Zero Google-hosted assets in the network panel (verified by CSP rule and visual grep)
Reduced motion: prefers-reduced-motion: reduce zeros all CSS transitions
and JavaScript animation intervals. A playwright getComputedStyle scan at
page end confirmed 0 holdouts across the full page.
Accessibility audit (Phase 6, headless playwright):
The a11y audit caught one real issue: strip labels were at 3.31:1 contrast
(11 px). Promoting --ink-faint from #8A8275 to #6B6657 brought those to
4.99:1 across all 16 affected sites. Every other text element passes WCAG AA;
most body text passes AAA (≥7:1).
Structure inventory:
- Skip link at
<body>top (added in the audit fix pass; was missing in v0) - Single
h1in the hero; singleh2in each of Ch 1–8 - 27 citation chips each with
role="button",tabindex="0", and descriptivearia-label - 4
aria-live="polite"regions covering live readouts (three-number strip, NWS fetch status, sandbox output, scenario label) - Unit toggle with
aria-pressedstate lang="en"on<html>- Focus rings: 2 px solid
wbgt-inkoutline on all interactive controls
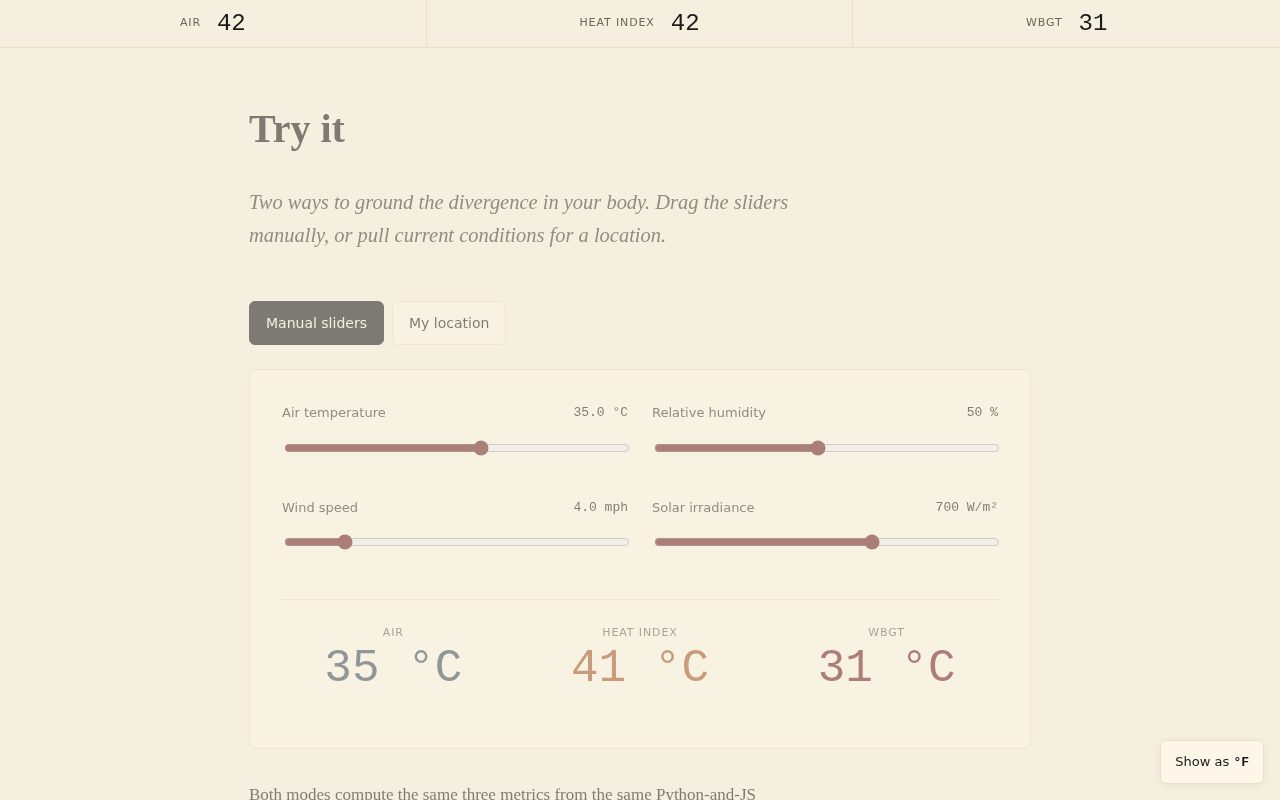 Plate VII. The Ch 7 sandbox (left) and live NWS panel (right). The sandbox
uses the same
Plate VII. The Ch 7 sandbox (left) and live NWS panel (right). The sandbox
uses the same src/metrics.js formulas as the drift gate — no separate
implementation. The live NWS path uses a two-stage api.weather.gov fetch
(/points/{lat},{lng} → forecastHourly) and renders a 6-hour mini-chart
as inline SVG. Solar elevation for the live path is estimated client-side from
cloud cover; no additional API call required.
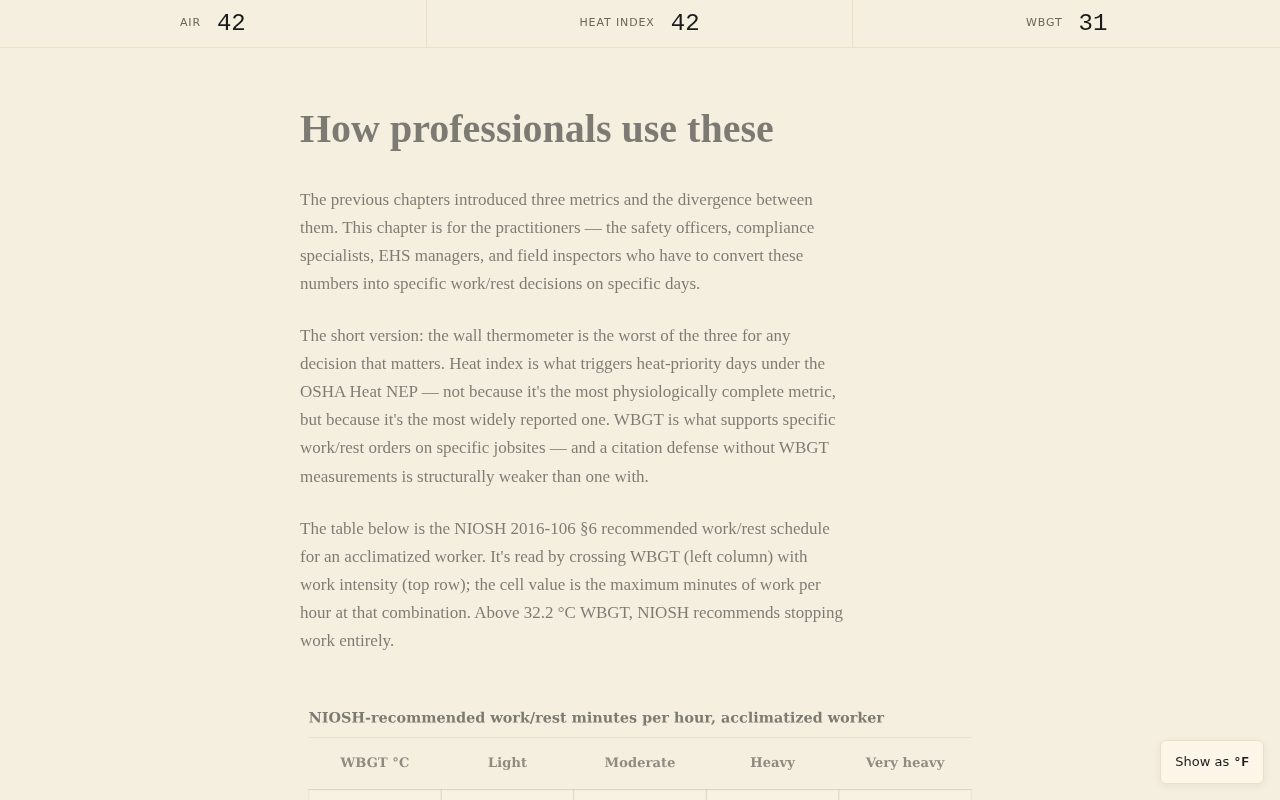 Plate VIII. The Ch 8 NIOSH work-rest table. Row tints carry severity encoding
(cream through amber to oxblood) so no separate legend is needed — the
multifunctioning-elements principle from the Tufte critique pass. The oxblood
bottom row (“stop work — exceeds NIOSH ceiling”) is the chapter’s load-bearing
visual moment.
Plate VIII. The Ch 8 NIOSH work-rest table. Row tints carry severity encoding
(cream through amber to oxblood) so no separate legend is needed — the
multifunctioning-elements principle from the Tufte critique pass. The oxblood
bottom row (“stop work — exceeds NIOSH ceiling”) is the chapter’s load-bearing
visual moment.
What I would do differently
One. The scenario flipper in Ch 4 uses Tab+Enter for navigation between
chips rather than the standard role="radiogroup" pattern with roving
tabindex. Functionally it works on keyboard; it does not satisfy the ARIA
radiogroup spec. This was filed as a v1.0.1 candidate after the Phase 6 a11y
audit (DEVREL Phase 6 observations). It is the kind of bug that slips through
a non-specialist audit and would be caught immediately by a screen-reader user.
I should have applied the radiogroup pattern in the original dispatch.
Two. The °F literals in regulatory citations (e.g., “OSHA Heat NEP
triggers at HI ≥80 °F”) do not auto-toggle when the reader selects Celsius.
The temp-text.js walker only matches °C literals; °F literals in prose
stay fixed. This is arguably correct for regulatory quotes — the source
document uses °F and presenting it as a °C equivalent could be confusing
without qualification. But from a UX standpoint it creates inconsistency: the
reader who has selected °C sees °F literals in the regulatory sections. The
right resolution is probably parenthetical conversions next to regulatory
thresholds, not the temp-text walker. I deferred this to Phase 6 as a
non-blocking item and then ran out of session.
Three. The posts/ HTML mirror infrastructure — a static mirror of
craigmerry.com posts built into the lab repo itself, the pattern I used for
heat-protein-lab — was deferred in full. The canonical post for this series is
at craigmerry.com; readers who find the repo won’t find the companion writing
there. Not a functional gap, but a consistency gap with the sibling project.
Where this goes next
The next post in this series is the A/B comparison — Antigravity 2.0 vs.
Claude Code, Google Science Skills vs. Python-fetched-and-formatted, Stitch
MCP vs. frontend-design + tufte-viz. That post will be longer and more
opinionated than this one. The telemetry for it (session-report builds for
both projects, saved at notes/session-reports/) is already in hand; the
analysis has been running in DEVREL.md since Phase 0.
After that: the drift-gate design is worth a standalone post. The implementation choice to run the drift check by importing the JS formulas via Node, running the same inputs through the Python, and diffing the outputs — rather than checking a few spot values manually — has a specific engineering rationale that I want to document.
The lab itself is a finished artifact. The plan does not include additional chapters. If a domain expert files a Scientific Correction issue, I will fix and re-publish. Otherwise the page stays.
Live at https://heat-metrics-lab.pages.dev/. Repo at craigm26/heat-metrics-lab. MIT.