What it is
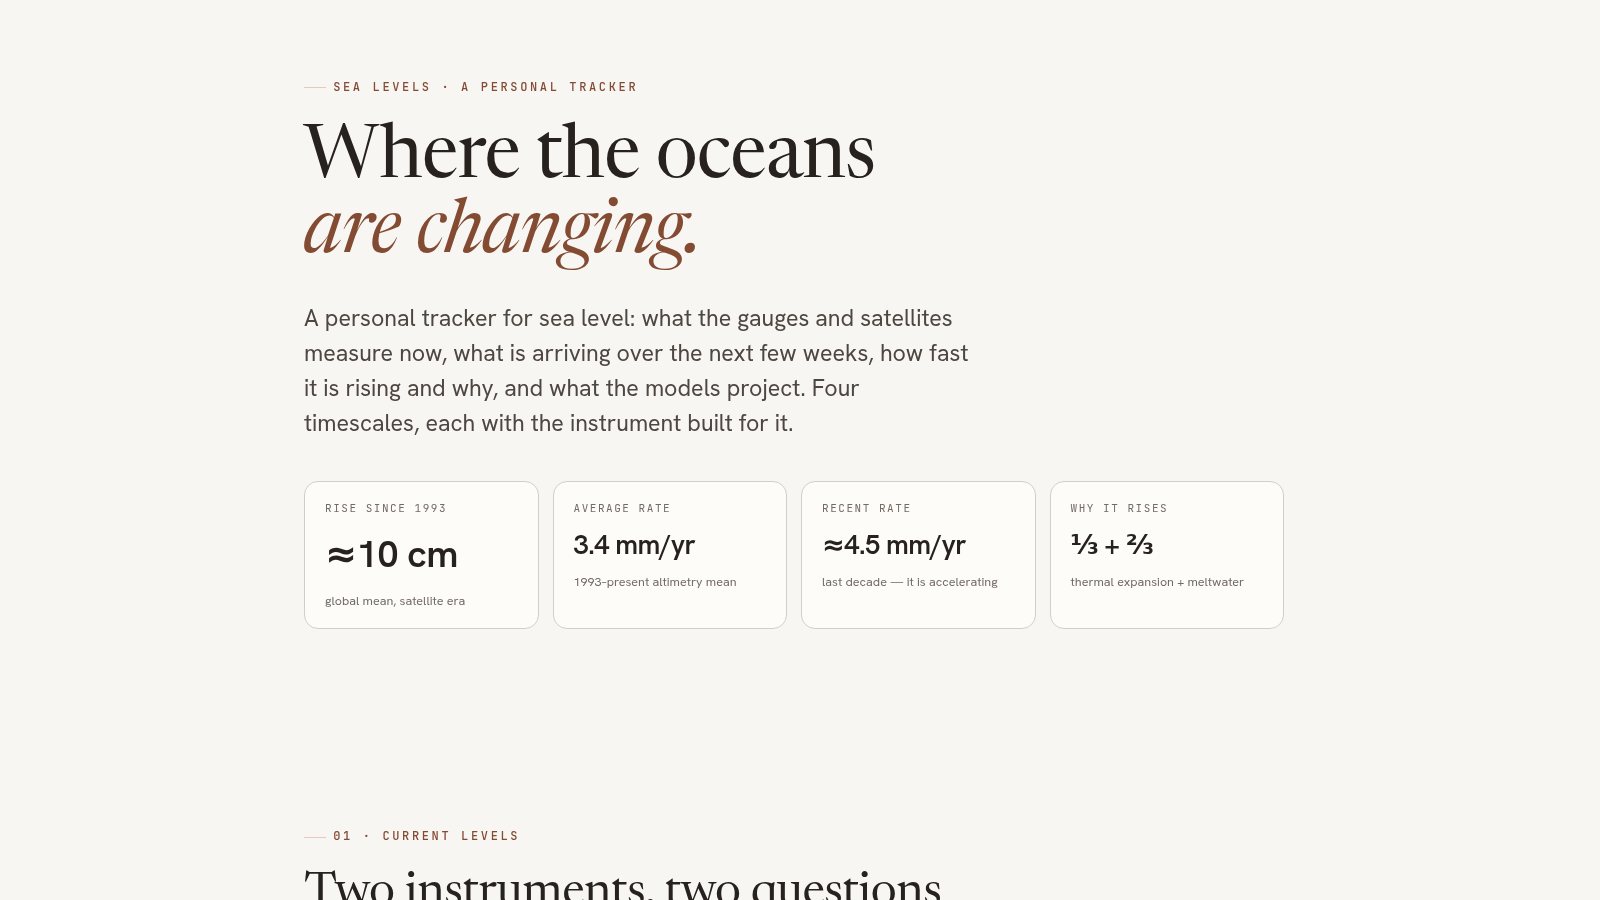
Sea Levels is a single page that answers four questions about the ocean, each with the measurement system built to answer it: where is the water now (tide gauges and satellite altimetry), what is arriving over the next few weeks (the residual at a chain of Pacific gauges, where El Niño’s coastally trapped waves show up), how fast is it rising and why (the altimetry record plus the GRACE-FO / Argo budget), and what comes next (IPCC AR6 and NOAA 2022 projections).
Open the tracker → /sealevels/
How it works
- Live tide gauges: the page queries the NOAA CO-OPS Data API directly from your browser, no backend, no key. Pick a station and get its latest six-minute reading plus ten years of monthly mean sea level.
- Weeks to months: eight open-coast stations from San Diego to Sitka, observed minus predicted water level per day with the long-term trend removed, drawn as a distance-along-coast versus time grid with a 6 mph reference slope. It is the tide-gauge version of the filtered altimetry diagram Dillon Amaya posted on 2026-09-01 showing a major coastally trapped wave from the Super El Niño heading for US waters. Live Niño 3.4 comes from the Miami companion’s ice monitor, and a range chart shows how trend, El Niño, wave pulses, the 2026 king tides, and storm surge stack on one California gauge.
- The satellite era: the global mean sea level record since 1993 (TOPEX/Poseidon → Jason → Sentinel-6) as an interactive chart, with the AR6 sea level budget term by term, roughly one-third thermal expansion, two-thirds meltwater.
- Projections: AR6 likely ranges for 2100 by emissions scenario (0.28–1.01 m) and the NOAA 2022 ~25–30 cm-by-2050 US-coast figure.
- Hand-built charts: no chart library, small React islands render SVG with crosshair tooltips and table fallbacks, validated for colorblind-safe palettes.
Why it matters
Relative sea level is local. The same ocean is rising ~9 mm/yr against Grand Isle, Louisiana (the delta is subsiding) while falling ~13 mm/yr at Juneau, Alaska (the land is rebounding faster than the sea can follow). Vertical land motion often dominates what any specific shoreline experiences, which is why the page pairs the global satellite record with per-station gauge data instead of quoting one number.
To see what these global curves mean when they arrive at one real coastline, this tracker has a local companion: Downtown Miami Flood Risk, LiDAR terrain, the aquifer, the drainage system, and a 3D visualiser for the place where US sea level exposure is most concentrated.