What it is
My Sea Levels tracker follows the global ocean, satellites, tide gauges, and model projections. This project asks the question those numbers can’t answer: what does sea level rise actually do to one specific place? The place is downtown Miami, Brickell through the CBD to Edgewater, and the answer turned out to contradict several assumptions the project started with.
It began as a way to settle a public argument about whether Miami’s exposure is “manageable,” and became a screening-level data package: LiDAR terrain, storm drainage, groundwater observations, building records, insurance filings, and sea level scenarios, all cross-referenced and published with their provenance visible.
How it works
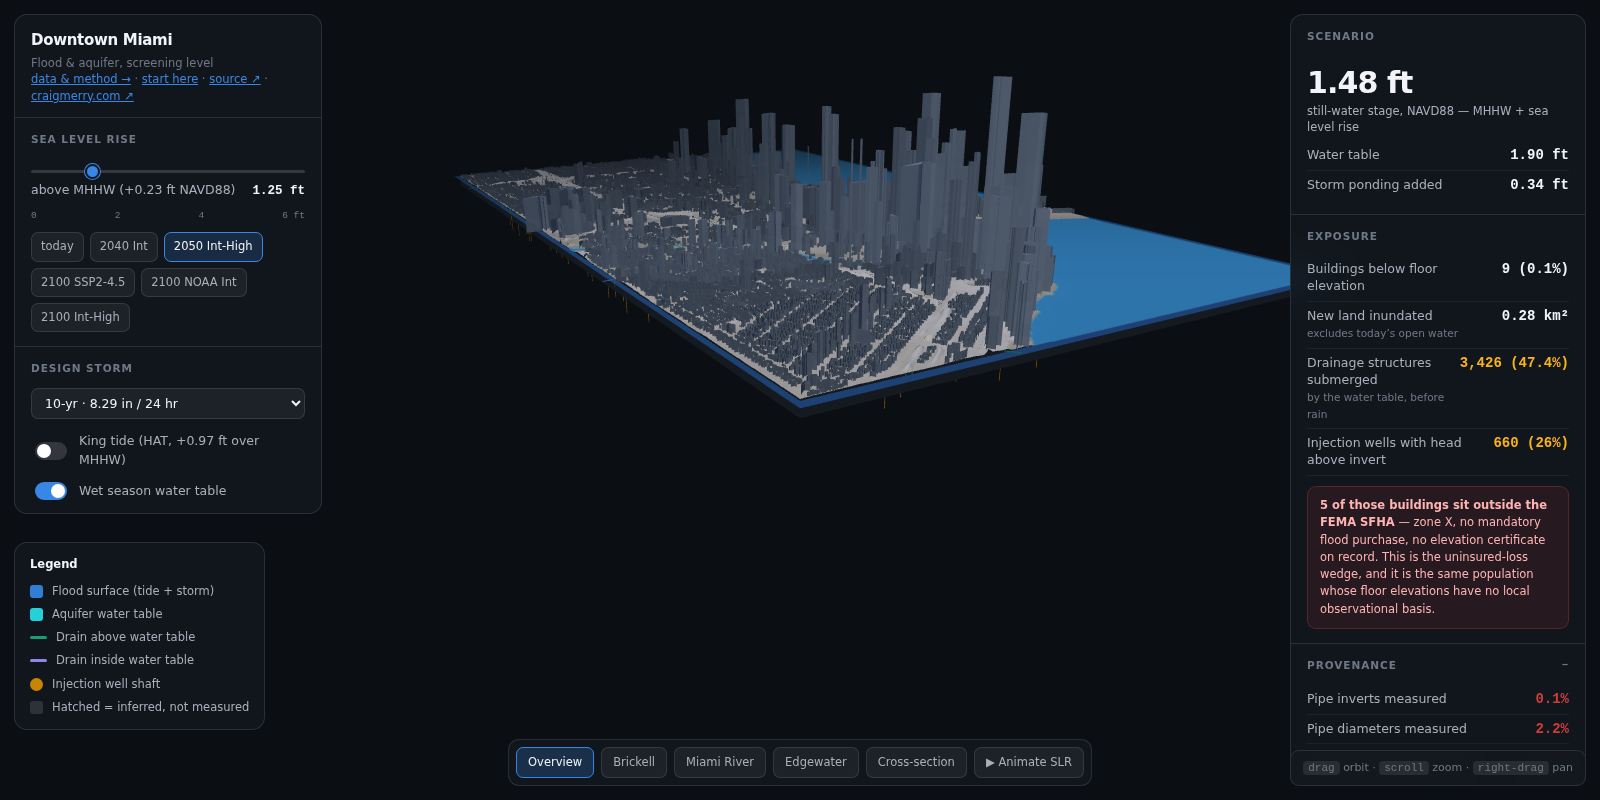
- A 3D visualiser (vendored Three.js, no build step) renders the LiDAR terrain, the Biscayne aquifer’s water table, the drainage network, and the injection wells together, with sliders for sea level and the groundwater coupling coefficient, an admitted screening assumption, exposed rather than buried.
- Provenance is the product. Only 2.2% of storm drain segments have a measured diameter; 77% of buildings have no observed floor elevation. Everything inferred renders hatched or dimmed and carries a count in the legend, because a confident map built on 98% inference is worse than no map.
- A live upstream ice monitor, a Cloudflare Worker on a six-hourly cron, tracks the Antarctic and Greenland indicators behind the high-end projection tails, plus weekly Niño 3.4, with the data lag printed on every number.
- A plain-language guide explains the whole system to a reader with no background, including the three things people most often get wrong.
Why it matters
The findings are the point. Downtown Miami has no surface outfall, it drains down, through 2,594 injection wells into the same aquifer the ocean pressurizes, and 54.8% of drainage structures already start the wet season below the water table. The local tide gauge runs +0.50 ft above the global mean at 2100, a third of it because the land is sinking. Global sea level curves are where the story starts; this is what it looks like when it arrives at a coastline.