Code Contributed Per Person, By Quarter
There is a chart that circulates in Anthropic’s visual house style — “code contributed per person, by quarter” — flat for years, then bending sharply upward as the models improve. I can’t tell you whether it is real; the copy I have seen is annotated with model names that don’t exist yet. But the question underneath it is real, and it is one I can answer precisely for exactly one person: what happens to an engineer’s output when AI moves from novelty to default?
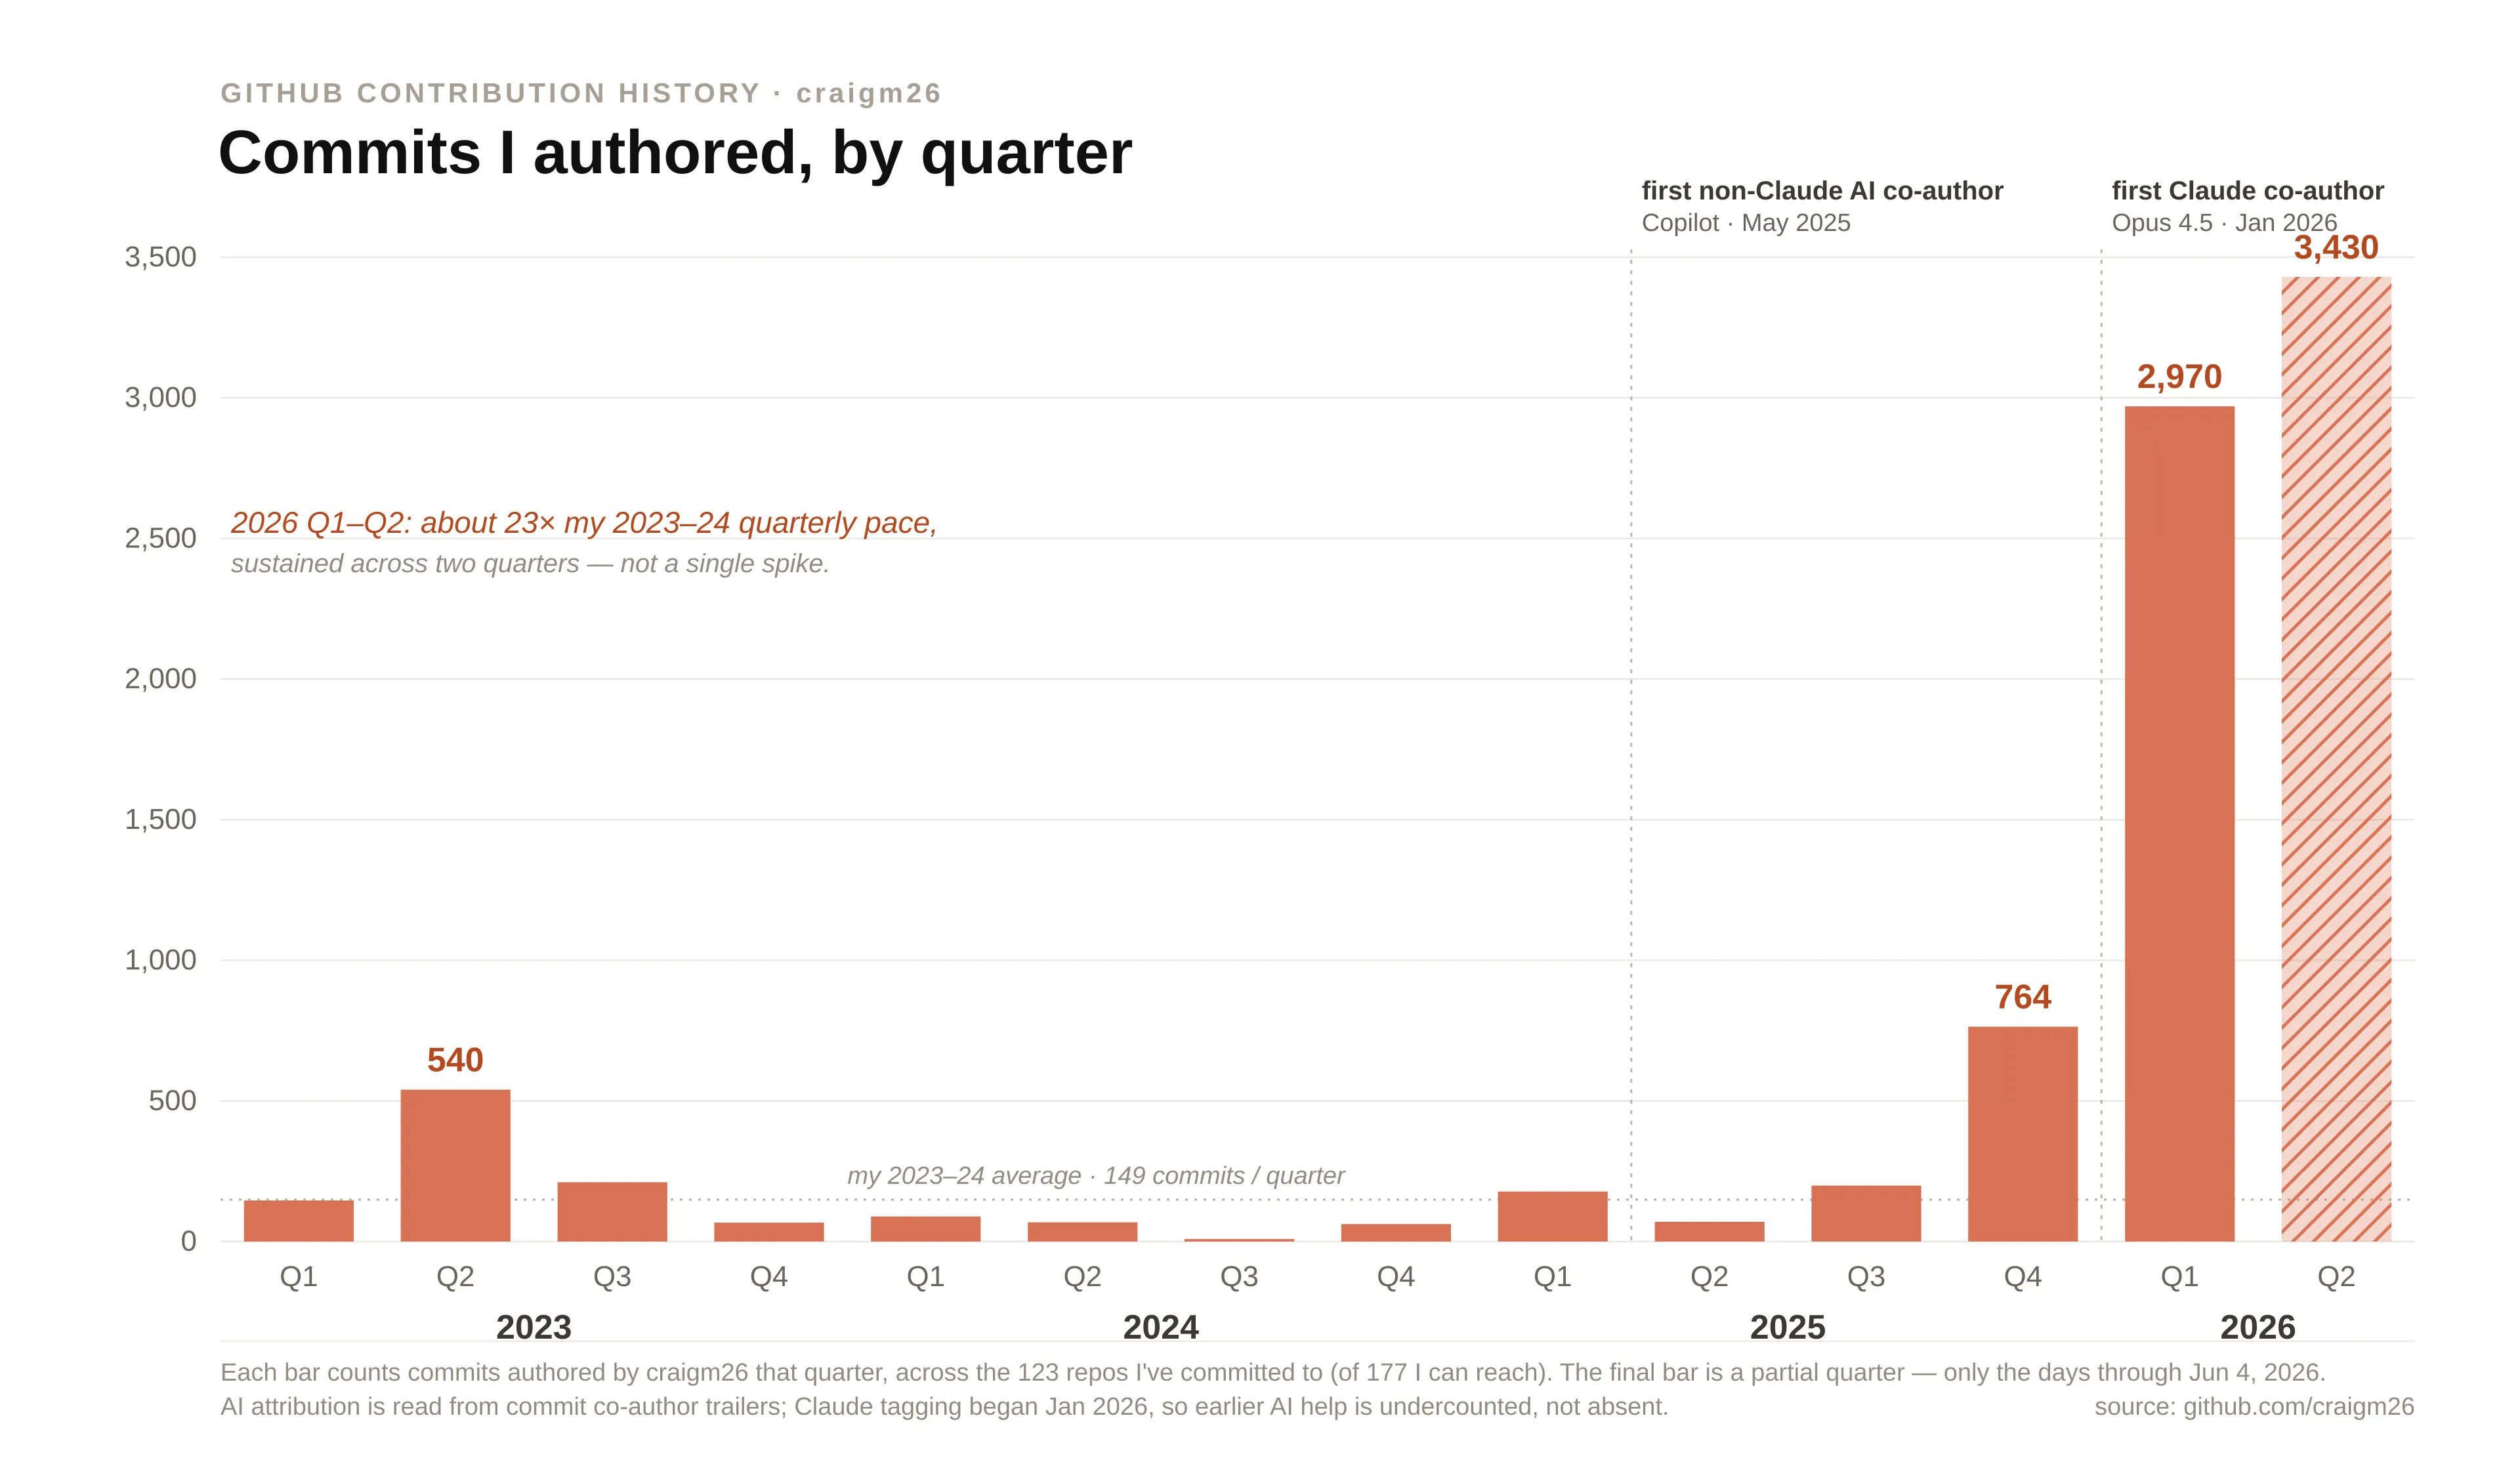
I have a GitHub account going back to 2014 and three dense years of commit history. So I measured it — every commit I have authored, 8,803 of them across the 123 repositories I have touched, bucketed by quarter and attributed to whoever actually wrote it. The chart at the top of this post is the result. I have had to sit with it for a while. The pace is hard to believe.
The shape is real
That is raw commit count — not the “lines of code merged per active contributor” the original chart measures, and deliberately so; I will come back to why. Through 2023 and 2024 I committed roughly 149 times a quarter. In the first quarter of 2026 I committed 2,970 times. In the second, through June 4 alone, 3,430. That is about 23 times my own prior pace, sustained across months rather than spent in a single spike.
I want to be exact about what that does and does not mean. It does not mean the software is twenty-three times better, or that I am twenty-three times the engineer. It means the act of shipping — opening the editor, making the change, committing it — now happens at a rate that would have been physically impossible for me to sustain two years ago. The pace itself is the finding.
Who is writing the code
The more important question is not how much, but who. These are the same commits, now divided by co-author: my own unassisted work, work done with Claude, and work done with other models.
For years it is almost entirely mine. Then, in early 2026, the composition changes completely. The reason my own work dominates until that point is itself a caveat worth stating up front: Claude only began appearing as a named co-author in my commits on January 4, 2026. A great deal of the 2025 work was already done with assistance; it simply was not labeled. The division you see is therefore a floor, not a ceiling — the true degree of collaboration is higher than the colors admit.
How much of the work is collaborative
By the middle of 2026, roughly two-thirds of everything I commit carries an AI co-author; in June it is 68%. The earliest months swing violently because the volumes are tiny — three commits in a month will read as zero or one hundred percent on almost nothing — which is why the markers are scaled to that month’s volume. The signal that matters is the steady climb from December 2025 onward, and it does not appear to be leveling off.
Which model
It is not one model but a succession of them. The co-author trailer names a version, so the hand-offs are legible.
Opus 4.7 did most of the work, with Sonnet 4.6 behind it, and the release cadence reads directly off the bars: Opus 4.5 in January, Sonnet 4.6 in February, Opus 4.7 in April, Opus 4.8 in May. The tool I rely on was replaced under me four times in five months, each version quietly more capable than the last.
Not only Claude
Claude is not the only model in the record. Gemini leads the rest, most of it from a concentrated stretch of hackathon work; the bulk of the Copilot commits are its autonomous agent opening pull requests. The first non-Claude assistant appears on May 19, 2025. None of it became a habit until late in the year.
Where the work happened
The output is not confined to a single project. 5,020 of these commits are in my own repositories; 3,783 are spread across 12 organizations. The eras are visible in the color — older work like bike-bus and homerunleague is entirely my own hand, while the newer platform work is saturated with assistance.
When the work happens
The work has a clear daily shape: almost nothing between two and four in the morning, then a full working day with peaks at midday and again from eight to nine in the evening, after the house is asleep. One detail stays with me — at seven in the morning, commits made with Claude outnumber my unassisted ones. It is the only hour of the day where that is true, and it says something about how the work now begins: the assistance is already there before I fully am.
Why I did not measure lines of code
The original chart measures lines of code, so I owe you that version. Here it is, and here is why I led with commits instead.
That resembles a clean curve only because I clipped it aggressively. My raw “lines added” total is 16.2 million, and 96% of it is volume I never wrote — lockfiles, vendored dependencies, generated bundles. A single regenerated bundle accounted for 2.1 million lines in one week. Capped at a generous ceiling, the authored signal survives and tracks the commit count closely. Left uncapped, lines of code would credit me with my most productive quarter ever in early 2025 — a quarter whose volume was almost entirely machine-generated files I never touched. It is the wrong instrument. Commits are coarse, but they are honest about the unit of work.
What the pace means
A few things this does not show, stated plainly, because the pace is only worth anything if the measurement is honest:
- Commits are not productivity, and lines are worse. A taller bar means I committed more often — not that the work is better, or that more of value was made.
- The AI split is a floor. Trailers only count when they were added. The real degree of assistance, especially before 2026, is higher than the colors show.
- It covers one identity. A few hundred commits under old work emails — all from 2023 to 2025 — are not included, which understates the early bars and never the recent ones.
- It is one person. n = 1. Generalize carefully.
With all of that accounted for, the inflection is real and it is large. Somewhere in late 2025 these tools stopped being something I was trying and became the medium I work in, and my contribution history now bends so sharply that you can see it from across the room. I am not a dramatically better engineer than I was two years ago. But I am working at a pace I would not have believed if someone had drawn me this chart in 2024 — and the line is still climbing.
Methodology: every commit authored by craigm26 across 177 accessible repos via the GitHub API (123 of them had commits); AI attribution parsed from commit co-author trailers and session links; models read from the trailer text; timestamps normalized to America/Los_Angeles; lines-of-code from the contributor-stats API, capped at 10k/week/repo to blunt bulk imports. Counts cover my [email protected] identity only, so a few hundred commits under old work emails — all from 2023–2025 — are not included; that undercounts the early bars, never the recent ones. The scripts and the raw aggregate are reproducible. Built, fittingly, with Claude.