How the Shade Map's numbers are made
Methods, data, checks and known errors, as of the data refresh of 2026-10-01: all 30 MLB parks and the spring training parks in Arizona and Florida, 19 of the 23 mapped. Every number below comes from the committed data and code; the companion file VALIDATION.md holds the full check tables.
Summary
For a chosen park, date, first pitch and game length, the page computes the sun's position every five minutes from an hour before first pitch to an hour after the expected end, using the NOAA Solar Calculator algorithm in the park's own time zone. Each park is reduced to two measured or assumed surfaces in a frame centred on home plate: a rim, the top edge of whatever surrounds the field, as one point per degree of bearing with a height, and a seat surface, where the seats are and how high. A seat is in shade at a given moment if the straight line from a viewer's eye, 1.1 m above that seat, toward the sun passes below the rim. Every number on the page is a count or an average of those yes-or-no answers over sample seats and time steps. The rims come from USGS 3DEP airborne lidar at 41 of the 48 mapped parks; the seat surface is measured from the same lidar at 20 parks, with the outfield seating at 17 of them, and assumed at the rest. Five parks have no map: Tropicana Field is under a fixed roof, and four Florida spring parks have no lidar of their stands as they are now.
- What the page reports
- Pipeline
- Data and provenance
- Frames and conventions
- The sun
- The rim
- Home plate and center field
- The seats
- The shade test
- From seats to the numbers
- Checks
- Uncertainty and known errors
- Reproducing it
- Sources and licenses
1. What the page reports
Notation: the game window is the set of five-minute steps k from first pitch to first pitch plus the game length, inclusive. A cell is a group of sample seats: a section and row at Sutter Health Park (one seat, at the middle of the row), or a zone and a depth row elsewhere (five seats, one at each of five bearings across the zone). For a cell at step k, fk is the fraction of its sample seats in shade.
| On the page | Definition |
|---|---|
| Map color, "At this time" | Zone parks: fk of each depth-row cell, binned as direct sun (f = 0), some shade (0 < f < 1/3), mostly shade (1/3 ≤ f < 1), shade (f = 1). Sutter: each row is sun or shade. |
| Map color, "Whole game" | The same four bins applied to the cell's share (below). |
| At [time] | For the seat card's cell at the scrubber's step: "Sun" if f = 0, "Shade" if f = 1, "Partly shaded (p% of the zone)" otherwise; at Sutter, the state of the one seat (sun, shade from the stands, shade under the overhang). "Sun is down" when the sun's apparent altitude is at or below 0 deg. |
| Shade arrives | The clock time of the first step in the game window with fk ≥ 0.5. "At first pitch" if that is the first step; "Shaded from first pitch" if the share is 1; "Not during the game" if no step qualifies. Marked "(sunset)" if the sun is down at that step. |
| Share of the game in shade | The mean of fk over the game window, as a percentage. |
| Rows (or depth rows) in shade now | Sutter: rows of the chosen section whose seat is not in sun at the step. Zone parks: depth rows of the chosen zone with fk ≥ 0.5. |
| Row-by-time chart | One column per step of the game window, one band per row (or depth row); colored by the same bins as the map. |
| Whole game, in short | Counted from the cells' shares: rows (or depth rows) with share exactly 1 are "shade for the whole game", share exactly 0 are "sun for the whole game", counted from the back and from the front of each zone; Sutter's overhang rows are counted apart, because they are shaded all day by rule. |
Night counts as shade throughout: a step with the sun at or below the horizon puts every seat in the "sun is down" state, which is not sun.
2. Pipeline
3. Data and provenance
| Source | Used for | Version | License |
|---|---|---|---|
| MLB Stats API teams endpoint (snapshot; URL below) | Venue ids, names, cities, IANA time zones, roof types, published fence distances; each club's spring venue and league; at parks without lidar, the venue point and centre-field azimuth | Snapshot 2026-10-01 (the 30 MLB parks it yields are byte for byte those of the 2026-09-25 snapshot) | Copyright MLB Advanced Media, L.P. |
| MLB Stats API schedule | "Pick a game", fetched live by the browser | Live | Copyright MLB Advanced Media, L.P. |
| ballpark-shadow-geometry (Adrien Peltzer) | Rims, home plates and centre-field bearings at 21 open-air MLB parks; the shadow calendar used as a check | Commit dec934b | Data CC BY 4.0, code MIT |
USGS 3DEP lidar, project USGS_LPC_CA_NoCAL_Wildfires_B5a_2018 | Sutter Health Park: rim, plate, bearing, seat heights | Flown 2019-02-10 and 2019-02-12 | Public domain |
USGS 3DEP lidar, project AZ_MaricopaPinal_1_2020 | The ten Arizona parks: rim, plate, bearing, seat surface, outfield wall | Flown 2020-11-20 to 2020-11-28 | Public domain |
| USGS 3DEP lidar, seven Florida projects (listed below) | The nine mapped Florida parks: the same measurements | Flown 2018-06-10 to 2019-04-15 (each park's dates in VALIDATION 10) | Public domain |
| OpenStreetMap stadium outlines | Only to centre the lidar download box, at 16 spring parks | Queried 2026-10-01 | ODbL |
| NOAA Solar Calculator | The sun algorithm (Meeus, Astronomical Algorithms), reimplemented | main.js as of 2026-09-25 | US government work |
The Florida projects, each the most recent 3DEP project whose footprint contains the park: FL_Peninsular_Pinellas_2018 (BayCare Ballpark), FL_Peninsular_FDEM_Charlotte_2018 (Charlotte Sports Park), FL_Peninsular_FDEM_Manatee_2018 (LECOM Park), FL_Peninsular_FDEM_Polk_2018 (Joker Marchant Stadium), FL_Peninsular_FDEM_Sarasota_2018 (Ed Smith Stadium), FL_Peninsular_FDEM_PalmBeach_2019 (CACTI Park of the Palm Beaches and Roger Dean Chevrolet Stadium) and USGS_LPC_FL_Southwest_A_2018_LAS_2019 (JetBlue Park and Hammond Stadium).
The snapshot also says which clubs train where: fifteen Cactus League clubs at ten venues in Arizona, fifteen Grapefruit League clubs at thirteen in Florida. Four of the Florida venues are listed with no map, because their only USGS lidar predates the stands: George M. Steinbrenner Field (2007 lidar, renovated 2017), TD Ballpark (December 2018 lidar, rebuilt 2019 to 2020), Clover Park (March 2019 lidar, renovated for 2020) and CoolToday Park (December 2018 lidar, while it was being built). No newer USGS lidar exists for any of them (checked against the 3DEP index and The National Map).
The snapshot URL is https://statsapi.mlb.com/api/v1/teams?sportId=1&hydrate=venue(location,fieldInfo,timezone),springVenue(location,fieldInfo,timezone). The lidar is read from USGS's public Entwine point tiles on AWS (s3://usgs-lidar-public/<project>/ept.json): only the octree nodes that intersect a box round each park, down to about 0.3 m point spacing. Flight dates are read from each return's GPS time.
4. Frames and conventions
- Origin: the back point of home plate. x east and y north in metres; z above field level z0, the median height of ground-classified lidar returns within 30 m of the plate.
- Bearings: degrees clockwise from true north. The centre-field bearing cf runs from the plate through the mound. Relative bearing rel = bearing − cf: the right-field line is rel = +45 deg, the left-field line +315 (−45), straight back from the plate +180.
- Latitude and longitude to metres (lidar scripts): 111,132 m per degree of latitude and 111,320 cos(latitude) m per degree of longitude about a local anchor, the same flat-earth factors the vendor pipeline uses; over the 330 m of a download box the error is well under 0.1 m.
- Time: every computation is in UTC; the park's IANA zone converts first pitch and the clock labels. Arizona's America/Phoenix has no daylight saving; Florida's America/New_York moves its clocks forward in the middle of spring training, on the second Sunday of March.
5. The sun
solar.js implements the NOAA Solar Calculator: Julian century from UTC, geometric mean longitude and anomaly, equation of centre, apparent longitude with the nutation term, corrected obliquity, declination and equation of time, then hour angle, zenith and azimuth for the park's latitude and longitude, plus NOAA's piecewise refraction (zero above 85 deg). The game track runs from first pitch minus 60 min to first pitch plus the game length plus 60 min, in 5 min steps; the scrubber covers all of it and the statistics use only the game window.
Against the calculator's own code at five parks and five dates the azimuth and altitude agree to 0.02 deg, and JPL Horizons agrees to the same order (VALIDATION.md sections 2 and 3, which also test the clock either side of each 2026 daylight-saving change).
6. The rim
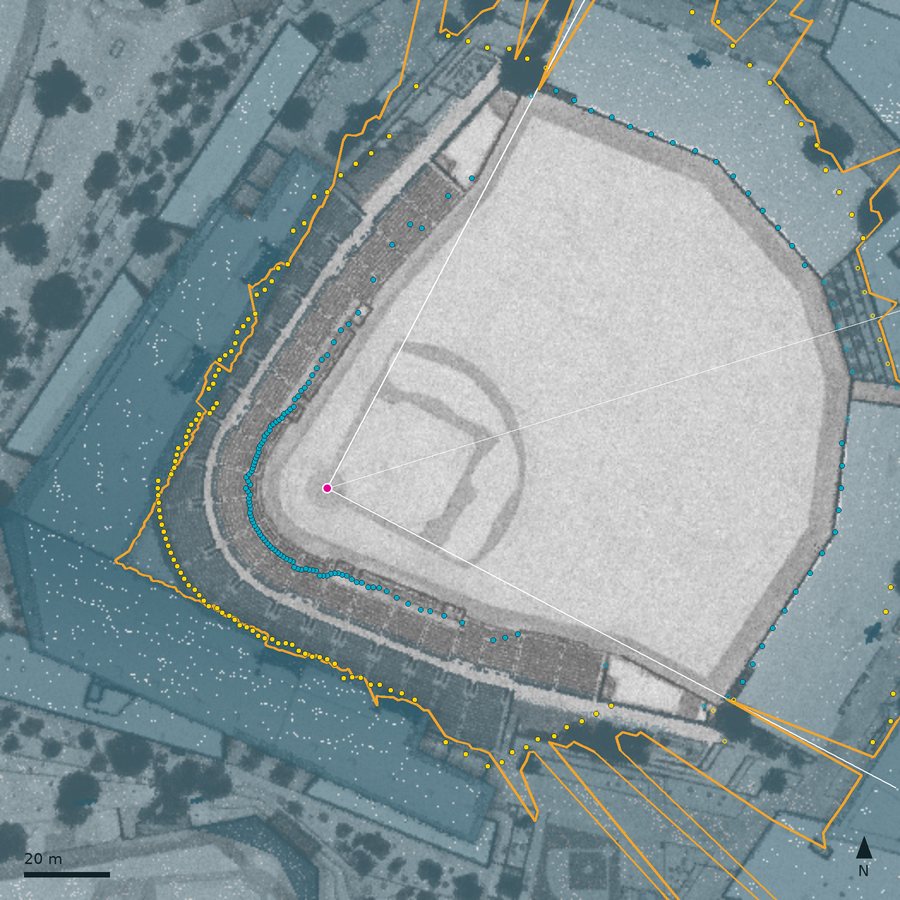
The rim is the top of whatever bounds the view from home plate in each direction: grandstand, roof, scoreboard, building, hill or tree. It is stored as 360 points, one per 1 deg bin of bearing from the plate, each with its plan position and its height above the field, and joined into a closed polyline.
Definition (lidar parks). In each 1 deg bin, of all returns 15 to 250 m from the plate, take the one with the 4th highest elevation angle seen from the plate at field level,
(the 4th rather than the highest so a bird or a wire cannot win a bin). Then narrow tall features, a run of bins at most 32 deg wide rising more than 3 deg above a 61 deg rolling median with a step of at least 4 deg at both ends, are replaced by the rolling median: light towers and masts, which cast thin moving shadows rather than shade a section. No bin is edited by hand. This is the vendor's method; Sutter Health Park and the spring parks run a port of the same code on fresh lidar. At the spring parks the playing field is cleared first: in fair territory, returns more than 2 m inside the outfield wall are dropped, because equipment left on the field when it was flown (a batting-practice screen, a cart) would otherwise win a bin. The clearing never reaches past MLB's published fence line, because behind a see-through fence the wall the lidar finds is the next structure out. That changes the rim at three Florida parks (35 bins at Joker Marchant, 4 at Roger Dean, 1 at JetBlue) and none in Arizona.
- 21 MLB parks: vendor rims.
- Sutter Health Park and the 19 mapped spring parks: measured here, same method.
- Seven retractable-roof parks: a circle 40.5 m high at 58.2 m, the median over the 21 measured parks of each park's median rim height and distance behind the plate; the roof is assumed open, and the label says "low".
- Tropicana Field: a fixed roof; no map.
7. Home plate and center field
Everything is measured from home plate, so its position and the centre-field bearing set where the seats are and which way the zones face. They come from three places.
- 21 MLB parks: the vendor's home-plate pins and plate-to-mound bearings, measured in Google Earth Pro.
- Sutter Health Park: from the lidar: the centre of the darkest 13 ft disc in lidar intensity (the home-plate dirt circle) and the dz-weighted centroid of the mound bump; the plate is 59 ft from the mound centre along that line.
- The spring parks: from the lidar, because a spring complex has up to a dozen fields. No hand pin; only a rough starting point at the two parks where the finder sees no mound (below).
The spring park field finder
- Mound candidates. On a 0.5 m grid of ground returns, the mean height within 1.5 m of a cell minus the mean over a 4.5 to 9 m ring, where the ring is flat (standard deviation under 0.06 m) and the rise is 0.12 to 0.5 m (a mound is 10 in high by rule). Up to 60 local maxima within 120 m of the download anchor.
- The stadium field. A candidate qualifies if structures stand round it (90th percentile height of all returns 30 to 60 m away at least 4 m) and if the lidar intensity 6 to 40 m from it is mirror-symmetric about some line through it, with correlation at least 0.7 (an infield is: dirt cutouts, base paths, chalk, and the seating bowl round it). Of those within 80 m of the anchor, the nearest; only at Roger Dean did two qualify.
- Mound centre: the dz-weighted centroid of the bump above a plane fitted to a 4.5 to 9 m ring.
- Centre-field axis: the line through the mound centre that maximises the correlation between the intensity image and its mirror image, searched in 0.25 deg steps over 180 deg, then in 0.05 deg steps within 1 deg combined with a lateral offset of up to 1 m. Home is the end with the grandstand.
- Home plate: the mound centre projected onto the axis, then 59 ft (17.98 m) toward home, because the mound circle's centre is 59 ft from the plate's back point by rule:
When the finder sees no mound. On the measure of step 1 the 17 mounds the finder chose rise 0.17 to 0.24 m. At LECOM Park, flown in November 2018, the mound was gone: nothing within 15 m of where it belongs rises more than 0.04 m. At Hammond Stadium, flown in June 2018, it is there (0.19 m), but those returns are not classified as ground, the only class step 1 reads. At these two parks the plate is the centre of the home-plate dirt circle, the darkest 13 ft disc within 4 m of a rough guess read off the lidar intensity image (the guess is recorded in the fetch script), placed on the symmetry axis found about the point 20 m from it toward the open field. At Hammond the mound, read from ground and unclassified returns together, is 0.4 m from where that plate and axis put it.
At every park the chosen axis correlates at 0.78 to 0.96 and the best axis more than 20 deg away at 0.27 to 0.55, so there is never a second candidate. The independent checks of the plate and bearing are in section 11.
8. The seats
A seat is a point on the seat surface; the viewer's eye is 1.1 m above it. Three kinds of seat surface are in use.
Generic bowl (21 MLB parks, 7 retractable-roof parks)
Along each bearing b from the plate the bowl runs from the field wall to 1.5 m short of the rim. The wall is the nearest of a backstop 18 m behind the plate and walls 15 m outside each foul line, capped so the bowl is at least 10 m deep. Seats rise in a straight line from 2.0 m above the field at the front to 3.0 m below the rim at the back, never steeper than 35 deg on average. A seat at depth d (0 = front row, 1 = last row):
Sutter Health Park
Twenty-two sections with estimated boundaries and row counts; each section's front distance, last-row distance and the heights of both are read from the lidar profile at the section's middle bearing; two or three overhang rows at the back of most sections are shaded all day by rule. VALIDATION.md sections 7 to 9.
Measured profile (the 19 mapped spring parks)
These bowls are low: behind home the last row the lidar sees is 1.9 to 5.2 m above the field in Arizona and 2.3 to 8.0 m in Florida (median at each park), under a rim 12 to 22 m high, where the generic bowl would put it 4.8 to 12.9 m higher. So the seat surface is measured:
- Every 2.5 deg of bearing, the median height of returns within 1 deg, in 0.5 m radial bins: on the foul side from 12 to 120 m from the plate; in fair territory, for the outfield seating, from 1 m behind the outfield wall to 200 m. Behind a see-through fence (no wall at MLB's published distance, and the first one more than 6 m beyond it) the wall found is something farther out, so the outfield profile starts 1 m behind the published fence line instead; between published points only beside such a point, because the line there is interpolated and an odd wall (JetBlue's) can sit metres outside it.
- Front: the first bin more than 0.5 m above the field. Front height: the median of the bins 1 to 2.5 m behind it (past the wall cap).
- Last row: the last bin before the height jumps more than 2.5 m within 1.5 m (a roof, a deck or a building), or drops more than 2.5 m within 1.5 m and does not come back within 4 m (the back of an open stand; a vomitory comes back).
- Cleaning, the foul side and fair territory separately: an entry counts only if its last row is at least 1 m up, at least 6 m behind its front and higher than its front, and in fair territory only if its front is at most 4 m up (a batter's eye or a scoreboard starts higher than any lawn or bleacher); a front under 0.3 m up takes the nearest good fronts on either side within 15 deg; each value is then the median of the good entries within 5 deg.
- A seat at depth d along bearing b sits on the plate ray at the same straight-line formulas as above with the measured front, last row and their heights, each interpolated linearly between the two 2.5 deg entries either side of b. No seats next to a missing entry.
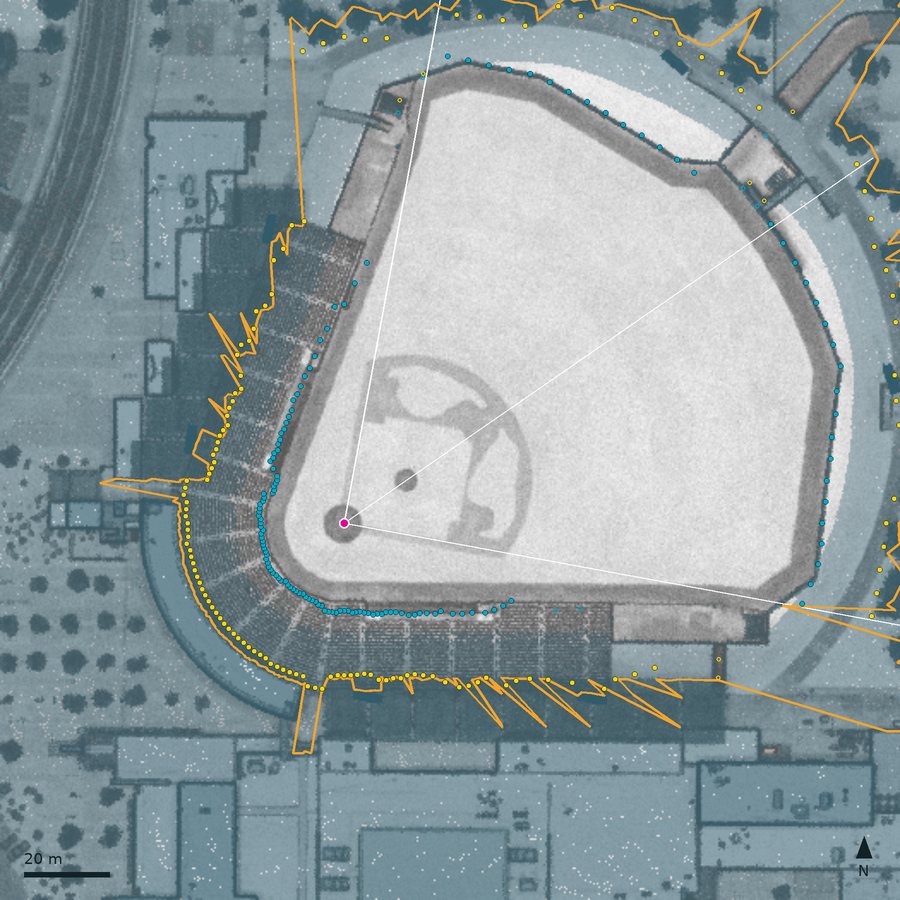
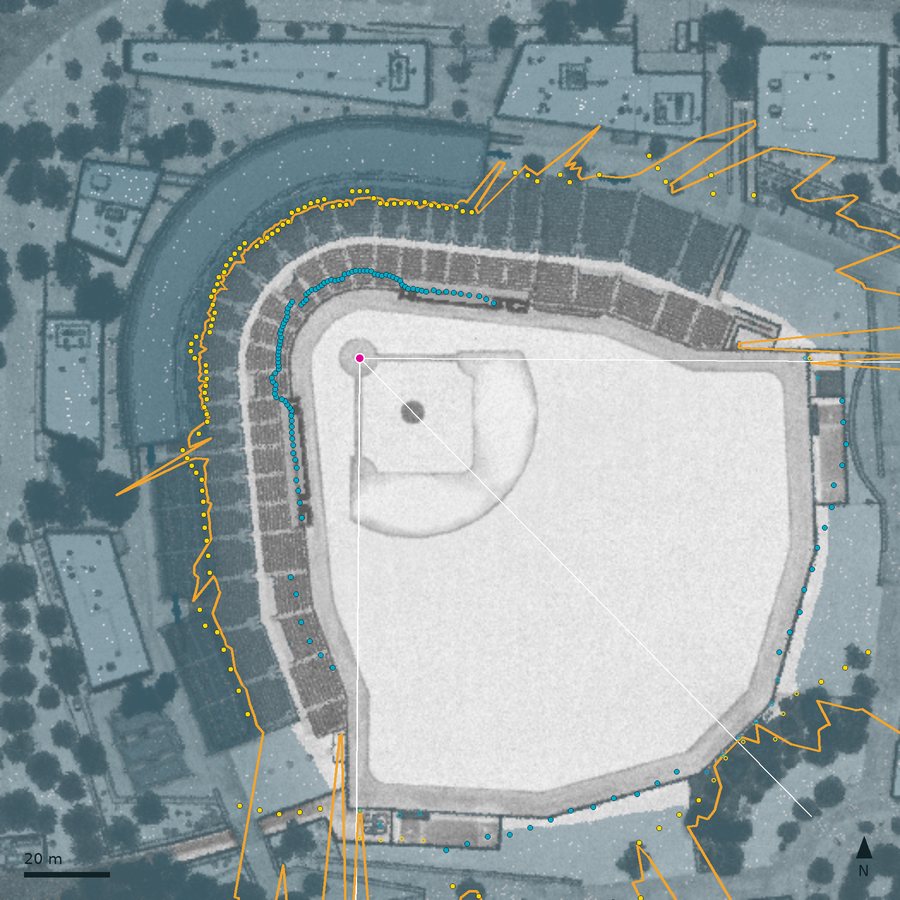
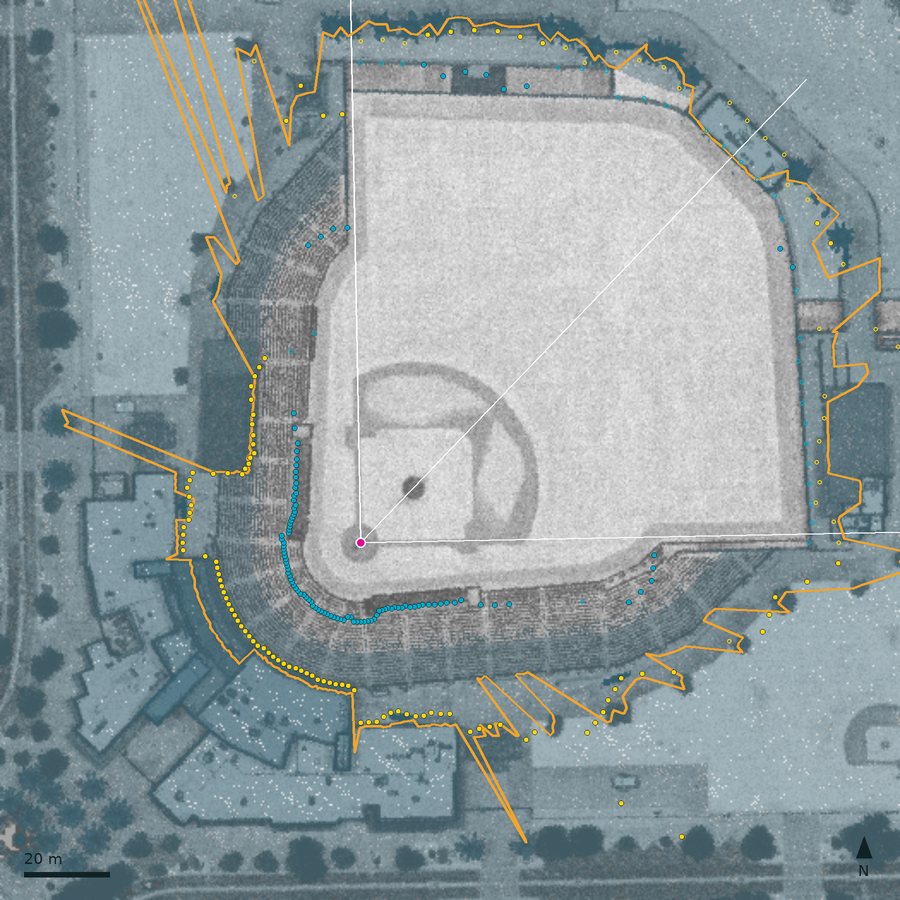
Plan views of all 19 mapped spring parks, drawn the same way as Figure 2 (click for full size), Arizona then Florida:
 American Family Fields of Phoenix
 Camelback Ranch
 Goodyear Ballpark
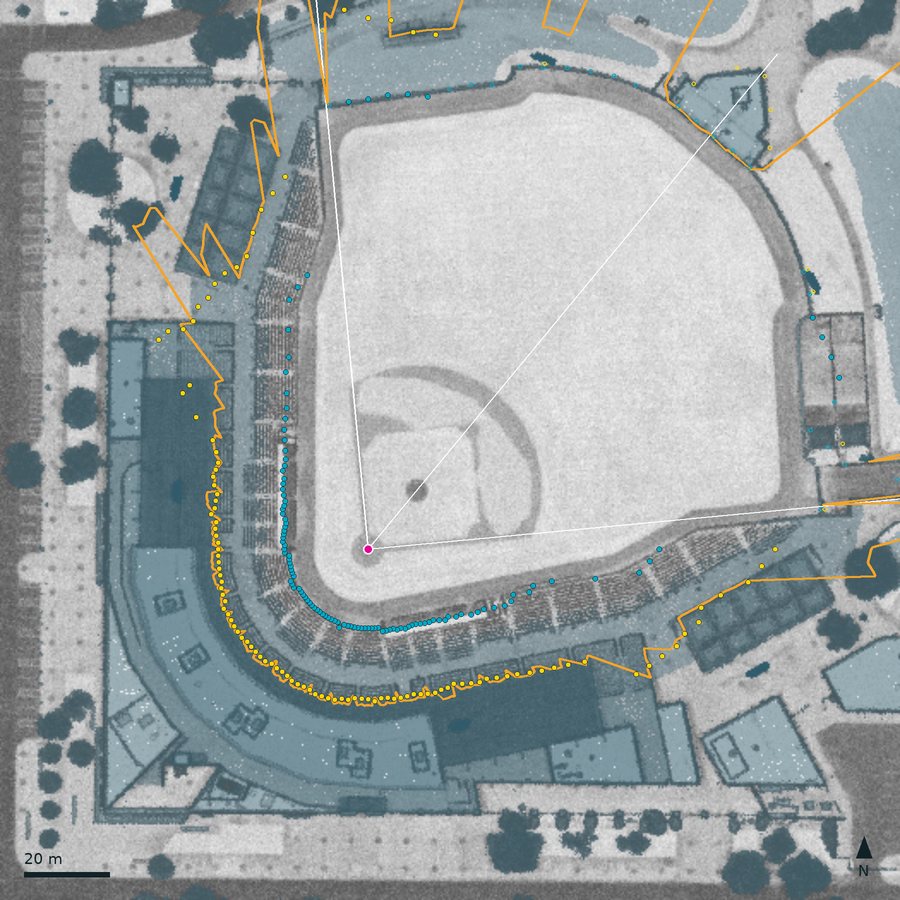 Hohokam Stadium
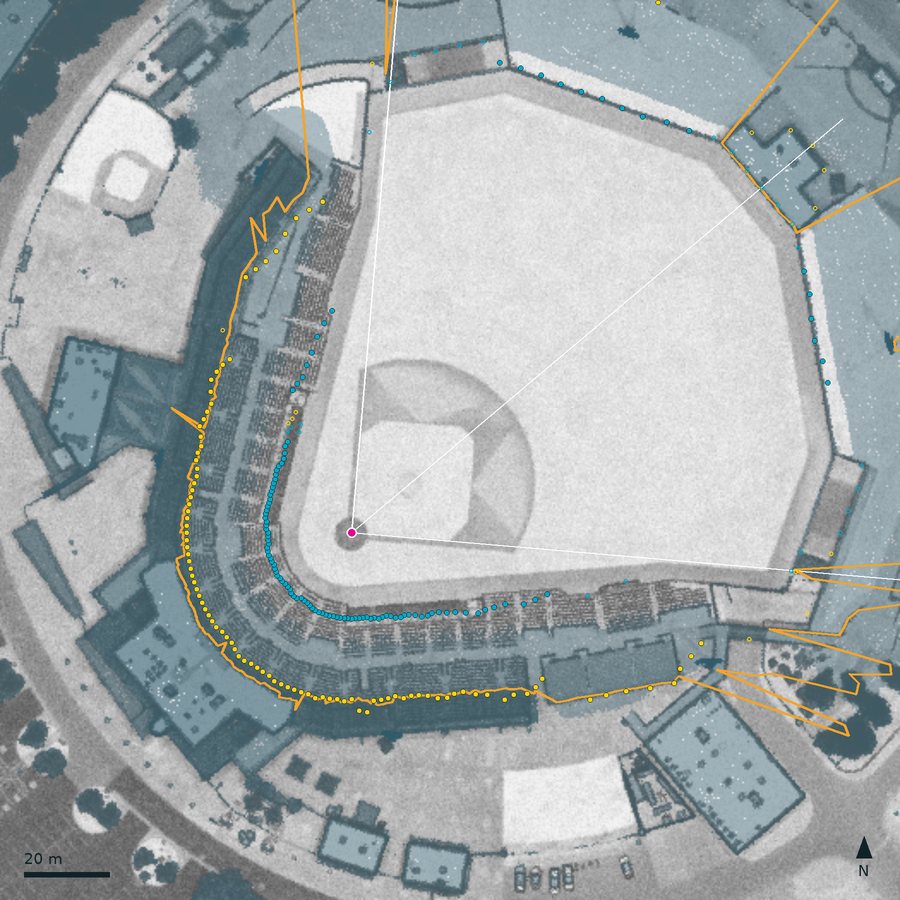 Peoria Stadium
Salt River Fields at Talking Stick
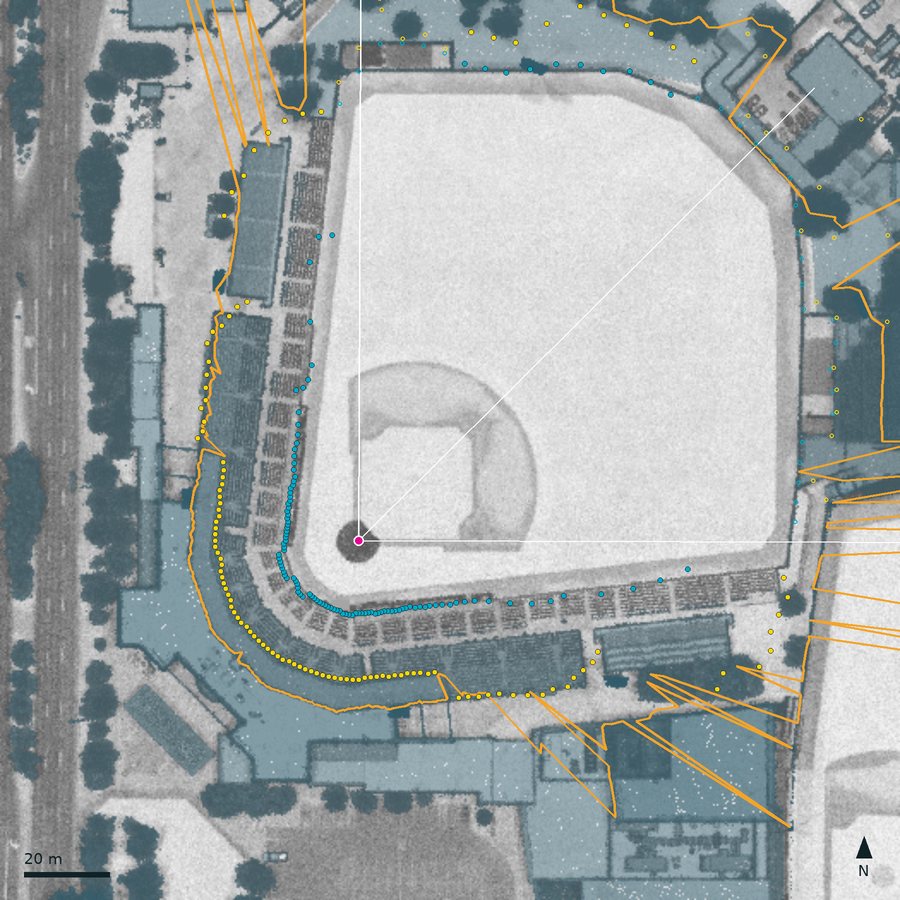 Scottsdale Stadium
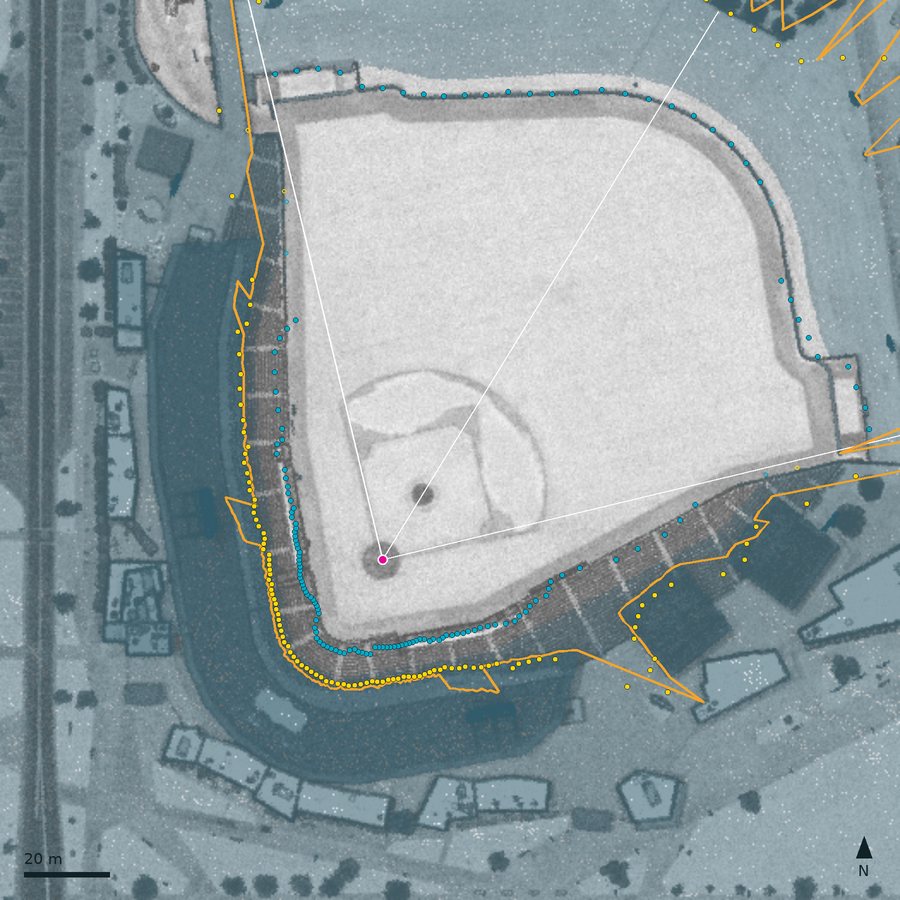 Sloan Park
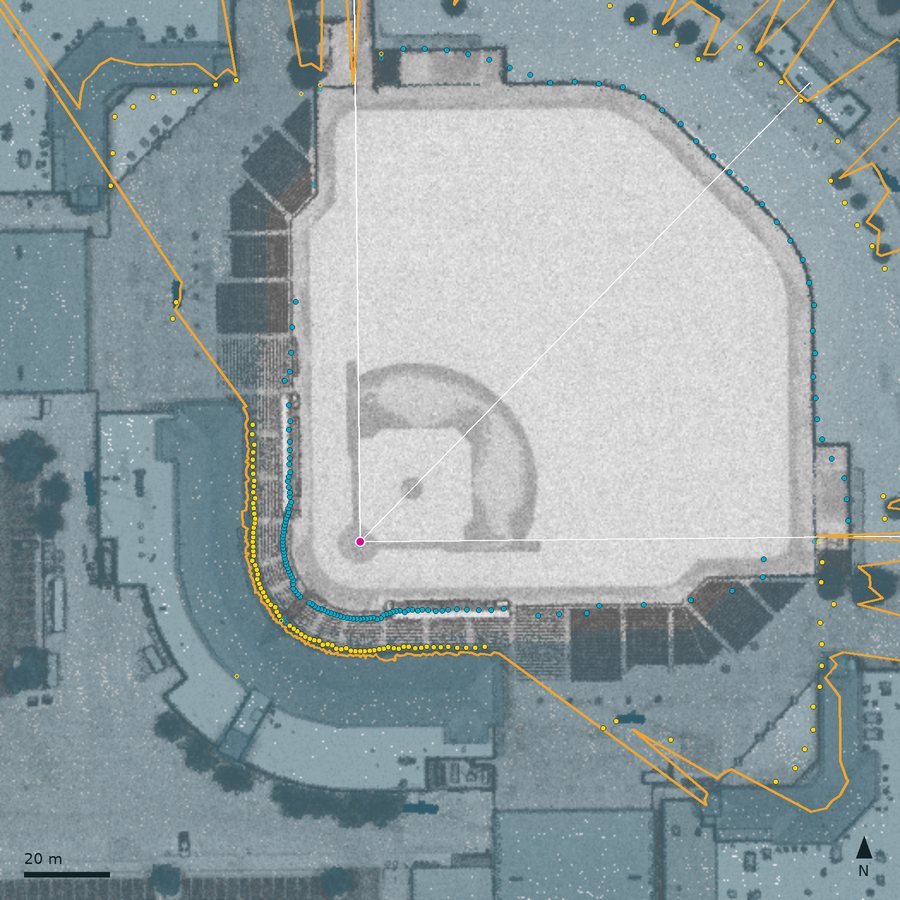 Surprise Stadium
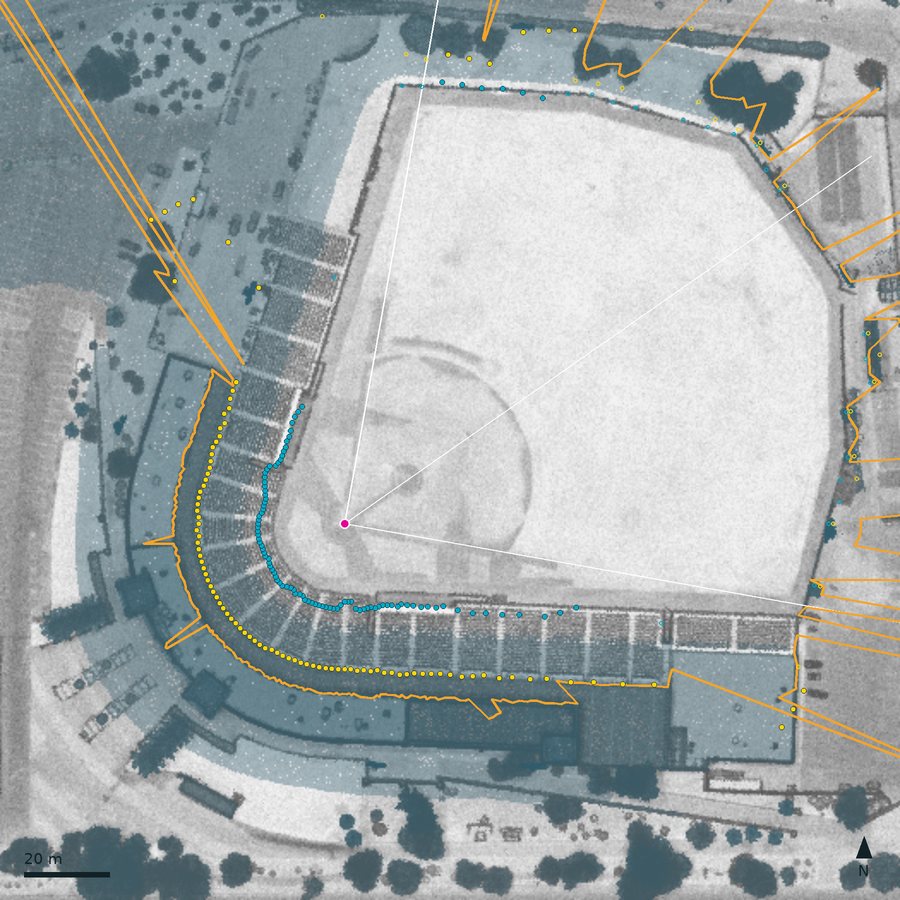 Tempe Diablo Stadium
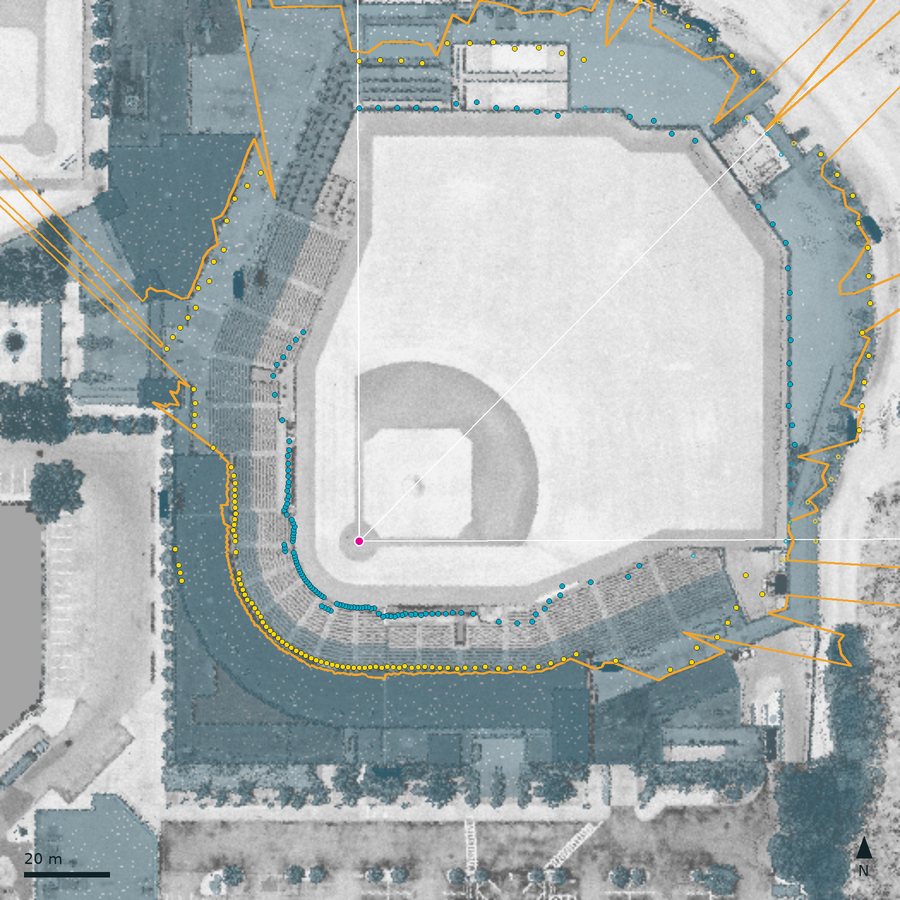 BayCare Ballpark
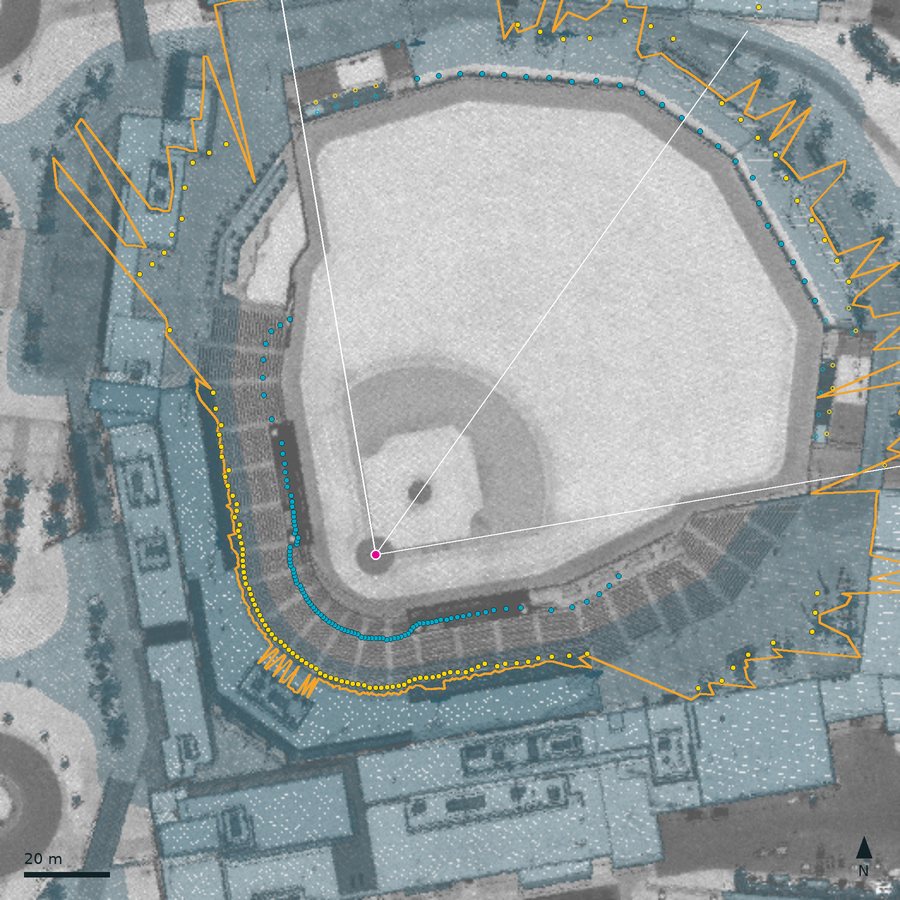 CACTI Park of the Palm Beaches
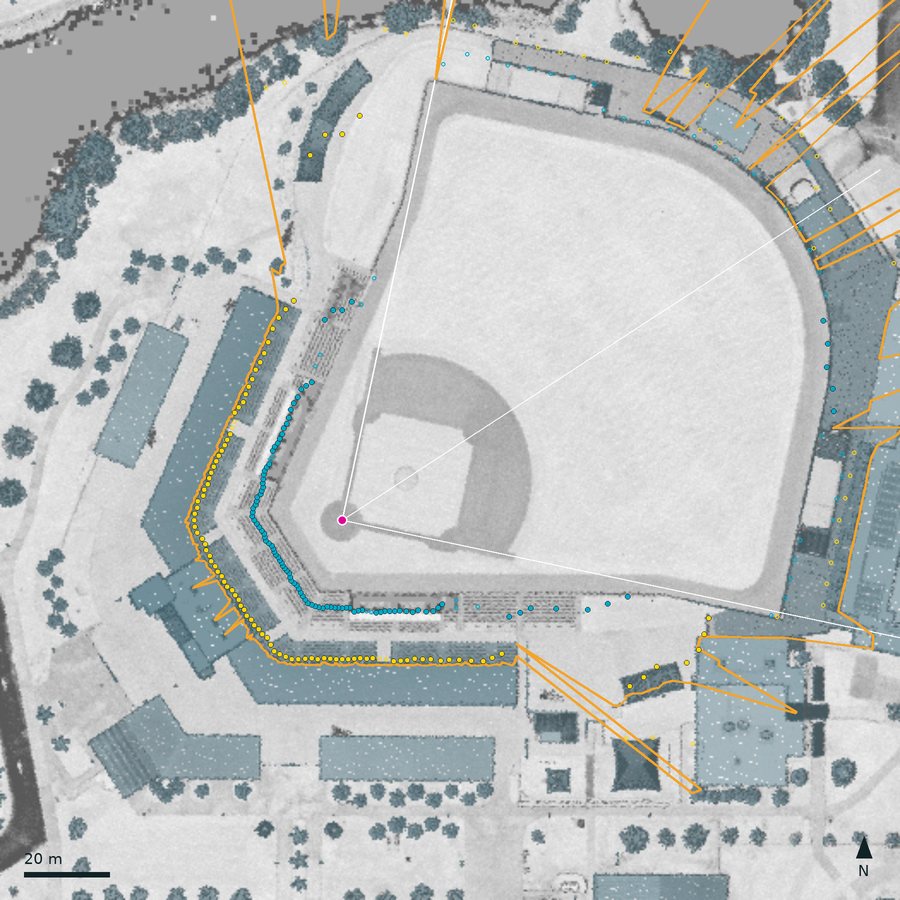 Charlotte Sports Park
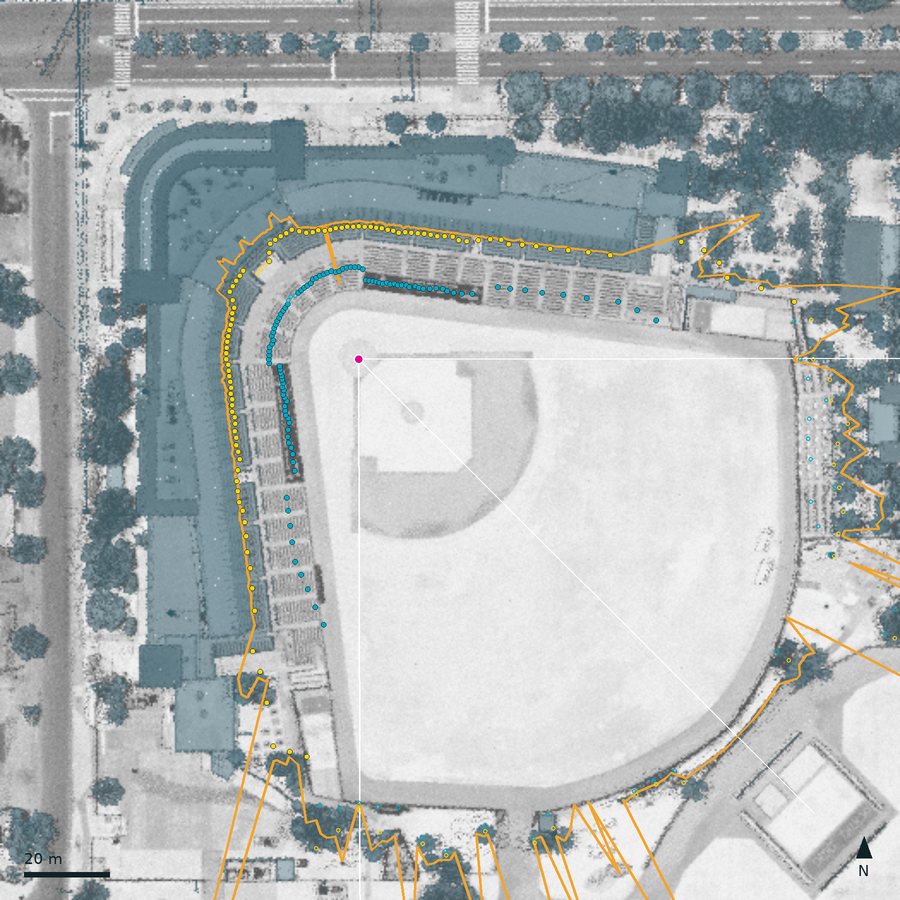 Ed Smith Stadium
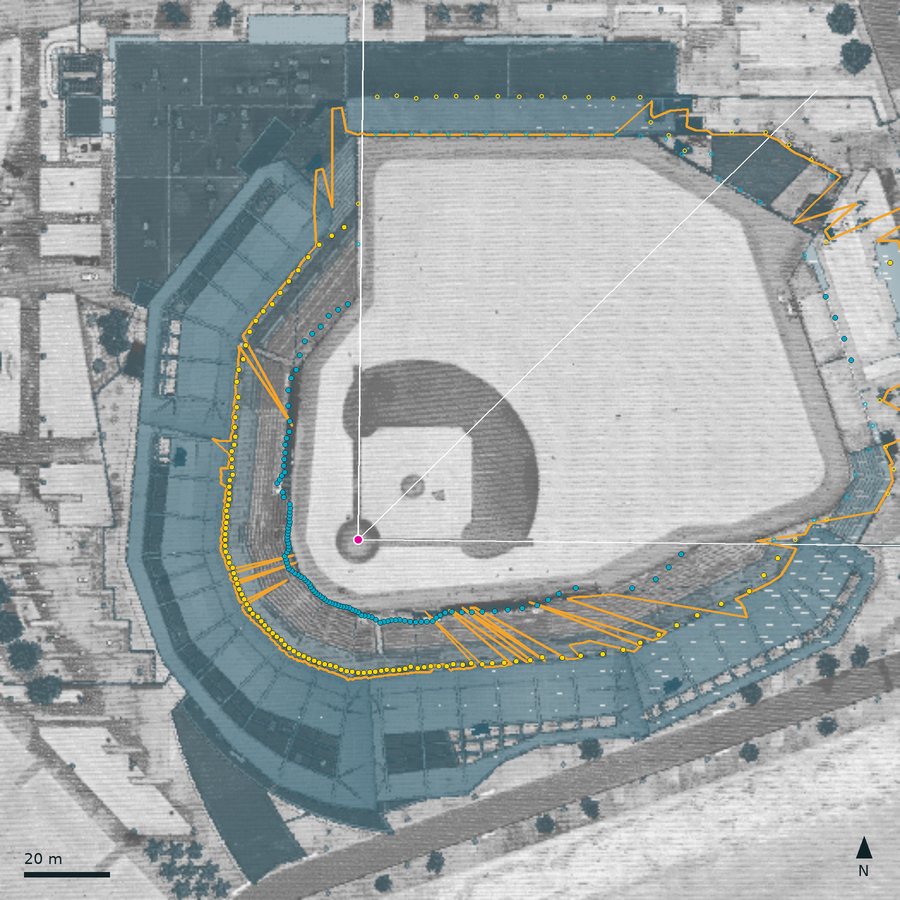 JetBlue Park
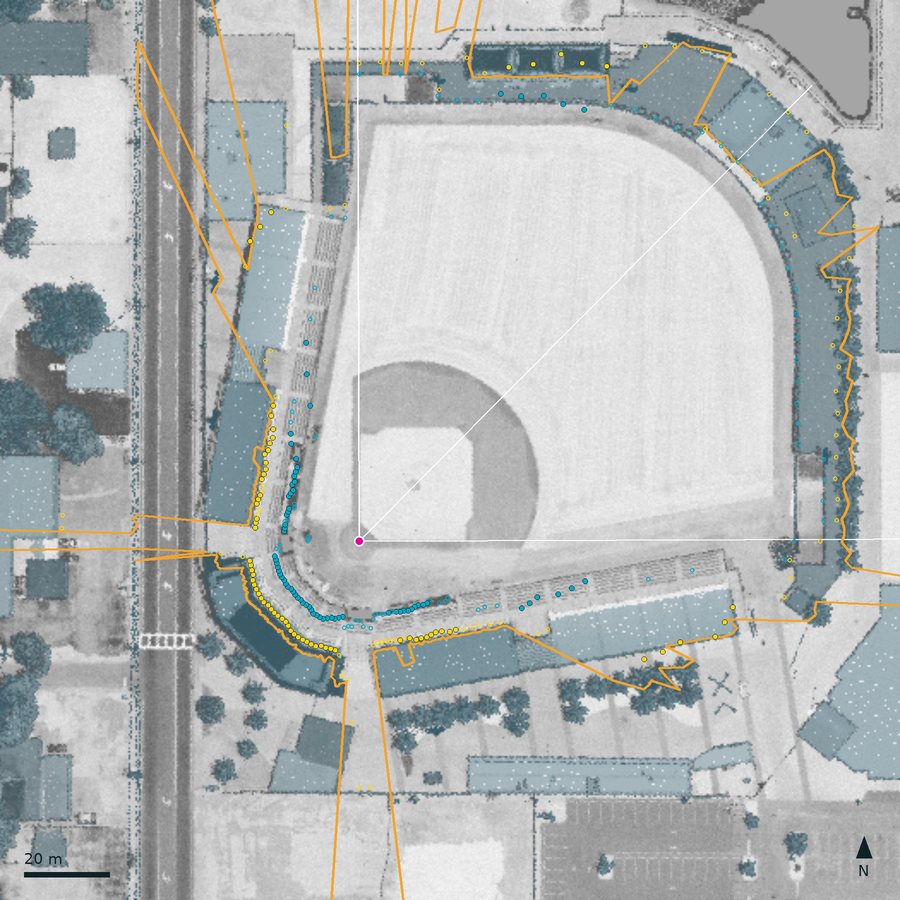 LECOM Park
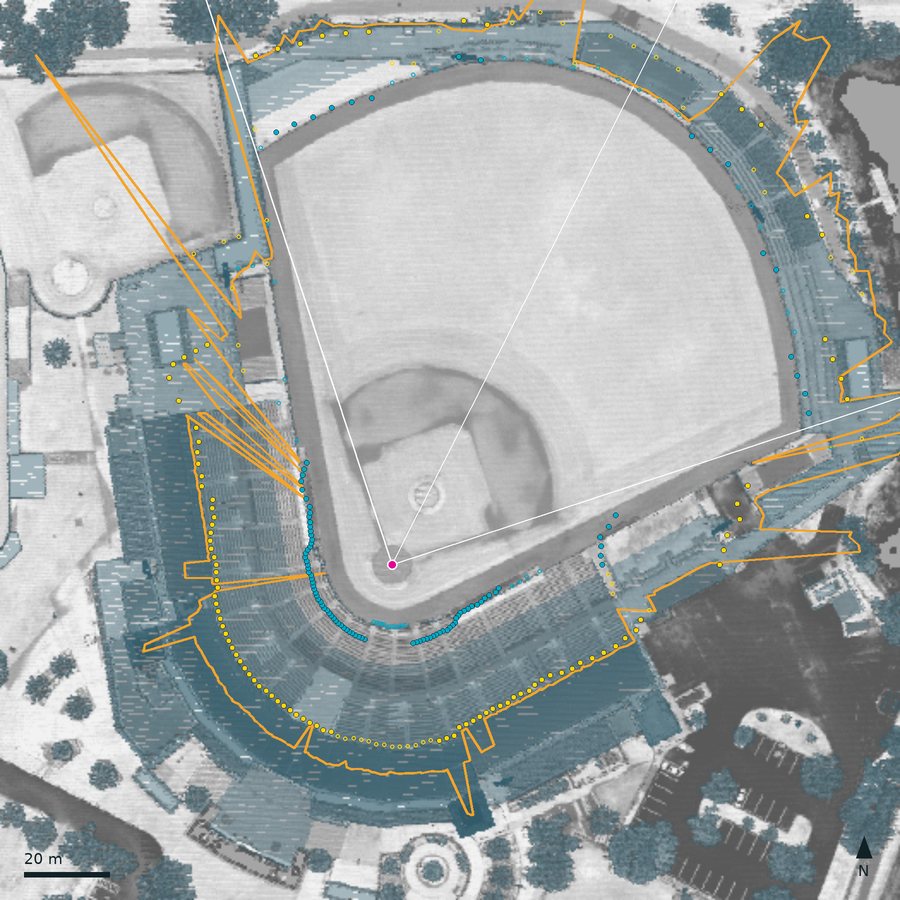 Hammond Stadium, Lee Health Sports Complex
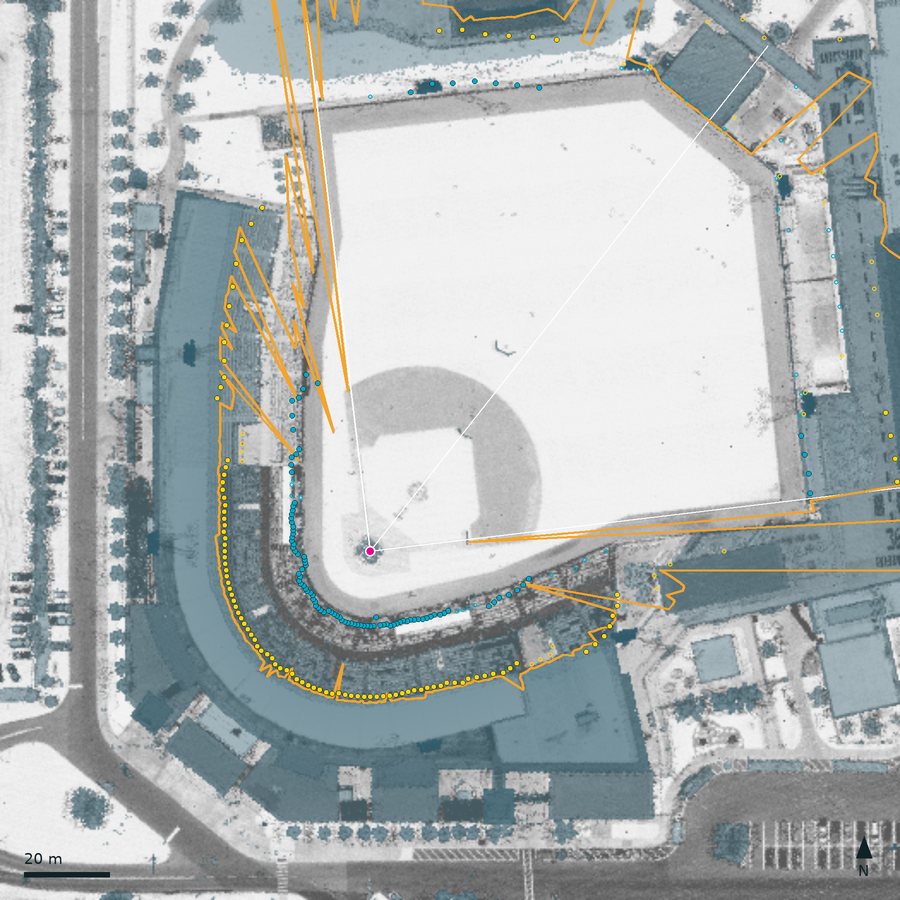 Publix Field at Joker Marchant Stadium
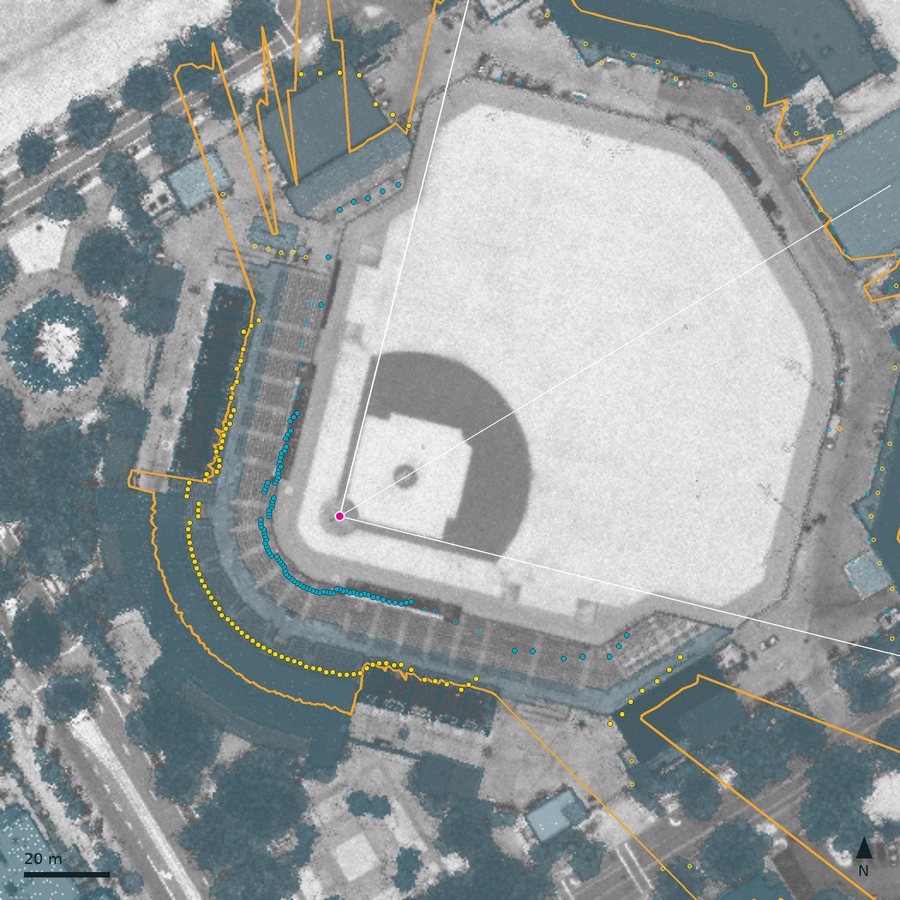 Roger Dean Chevrolet Stadium
9. The shade test
For a seat with eye at (x, y, zeye) and a sun at azimuth A and apparent altitude h > 0, walk in plan from the eye along u = (sin A, cos A). For every rim segment the walk crosses, at horizontal distance t > 0, read the rim height H at the crossing by linear interpolation along the segment. Then
A walk that crosses nothing sees open sky. A seat is also in shade when the sun is at or below the horizon ("sun is down"), or when it is an overhang row at Sutter Health Park (shaded all day by rule). For speed, rim segments are bucketed once per time step by their offset across the sun's direction, so each seat tests only the few segments its walk can cross; the result is checked equal to testing every segment.
The rim is a skyline seen from home plate, not a full 3-D model: a structure hidden behind a taller one from the plate's point of view is missing, even if it would shade seats beside it, and anything above a seat's row that is not on the skyline (an upper deck, a roof) is missing too. Sutter's overhang rows are the only exception.
10. From seats to the numbers
- Sutter Health Park: one sample seat per section and row, at the middle of the row: 644 seats.
- Zone parks: five zones by relative bearing (RF corner 50 to 80 deg, 1B side 80 to 150, behind home 150 to 210, 3B side 210 to 280, LF corner 280 to 310), plus three outfield zones (left field 315 to 345, center field 345 to 15, right field 15 to 45) at the 17 spring parks whose profile found seating behind the wall, and ten depth rows. A depth-row cell holds five seats at bearings rel0 + (i + 0.5)/5 (rel1 − rel0), i = 0 to 4, all at depth (r + 0.5)/10 for depth row r = 0 to 9. The seat card's cell holds the same five bearings at the chosen depth. A bearing with no seat (no seat surface there) drops out of the cell; a zone with none at all says "No seats measured here", and the seat picker marks it "(no seats measured)".
- For each cell and step, fk = shaded seats / seats. The definitions in section 1 follow from it. A park's whole game is computed once per input change; moving the scrubber only reads it.
The map's zones are drawn schematically, the same shape at every zone park (the outfield bands just behind the park's published fence line); only the colors come from the park's geometry. The numbers do not depend on the drawing.
11. Checks
| What | Against | Result | Where |
|---|---|---|---|
| Sun position | NOAA's own code; JPL Horizons | Within 0.02 deg of NOAA at five parks and dates; JPL agrees to the same order | VALIDATION 2 |
| Park clocks | Known UTC instants either side of every 2026 DST change | Exact, including the hours that do not exist or repeat | VALIDATION 3 |
| Rim and sun together (21 MLB parks) | The vendor's independent shadow calendar: the minute home plate goes into shade, on four dates | 75 of the 84 park-days comparable: median difference 1 min, 90th percentile 6 min, every gap over 6 min traced to a rim feature 1 to 3 deg wide. With the calendar's own rim method, this sun and clock reproduce all 84 to the minute | VALIDATION 4 |
| Sutter Health Park shade | Nine dated photos, 2025 and 2026 | Matches four midday photos, the 5:24 pm one and two evening ones; 30 to 45 min late on the third-base side around 4:30 to 5 pm, cause not found | VALIDATION 9 |
| Spring park plate and bearing | MLB's published fence distances (independent of the lidar method) | 47 of the 50 checks where the lidar shows a wall at the published distance are within 5 ft. Arizona: foul lines 19 of 20 within 4 ft, median −1 ft; center field 9 of 10 within 5 ft, median −3 ft (Goodyear +8 ft, where no wall is seen at the published 400 ft). Seven checks have no wall to see (see-through fences) and say nothing | VALIDATION 10, Figure 5 |
| Spring park plate | The home-plate dirt circle in lidar intensity (independent of the mound) | Within 0.79 m at ten of the eleven mound-method parks where the circle is clear; 2.06 m at JetBlue Park | VALIDATION 10 |
| Plate and bearing at Hammond Stadium (dirt-circle method) | The mound in ground and unclassified returns, which the method did not use | 0.4 m from where the plate and axis put it | VALIDATION 10 |
| Spring park bearing | MLB API azimuth (Salt River Fields only) | 72 deg against 72.8 | VALIDATION 10 |
| Spring park shade | Dated photos | Not done yet |
12. Uncertainty and known errors
- Rim steps. Near a step or a notch in the rim a shade time carries about 10 min of uncertainty from the rim alone (VALIDATION 4).
- Plate and bearing (spring parks). The plate is within about 1 m (dirt circle, fence distances), about 2 m at JetBlue Park, whose lidar comes from two flights four months apart; the centre-field wall reads about 3 ft short at most parks, which would fit a plate placed up to 1 m toward center field. The axis moves at most 2.5 deg (LECOM Park) when its search window shrinks. Neither changes the shade itself much: the rim and the seats are measured in place, and the bearing only sets the zone boundaries.
- Covered seats (spring parks). Seats under a roof are hidden from the lidar and left off the map. At parks with a big roof, Sloan Park above all, and at LECOM Park and Hammond Stadium, whose grandstands are roofed, that is many of the shadiest seats.
- Outfield seating (spring parks). Any surface behind the outfield wall that passes the cleaning rules counts as seating, so a sloping lawn nobody sits on would count too, and seats on top of a tall wall do not (JetBlue's left-field wall, 11.8 m up where the lidar sees it). Behind a see-through fence the seats are looked for from the published fence line (Roger Dean still shows none); where the first solid thing is less than 6 m behind such a fence (CACTI Park's left-field line, Goodyear's center), from behind that thing, so a row or two could be missed.
- Low front rows (spring parks). The front is the first point 0.5 m above the field, so rows lower than that are cut. The lidar shows how much: the run of non-ground returns in front of the detected front is a median of 0 to 1.5 m along the foul side at each Arizona park and 0 to 2.5 m in Florida; behind home it reaches 3 m at Goodyear, Charlotte Sports Park, Ed Smith Stadium and JetBlue Park, and 3.5 m at LECOM Park. There the model's front row is two to four rows back from the real one (
low_rows_before_front_min spring-lidar.json). - Straight seat line. The seats rise in a straight line from front to last row; real banks step at cross-aisles. Along the foul side of the 19 mapped spring parks the raw lidar heights stray from that line by an RMS of 0.49 m (median over all banks; 90th percentile 0.88 m; per park 0.27 to 0.77 m), which includes the up and down of the rows themselves (
line_rms_min spring-lidar.json). - Generic seats at the 21 MLB lidar parks and the seven retractable-roof parks: the seats are a sketch there, and the label says so.
- Not modelled: netting, clouds, haze, the partial shade of trees, and anything built after each lidar flight (Florida 2018 to 2019, Arizona November 2020, Sutter February 2019, the vendor parks 2010 to 2022).
- Not mapped: four Florida spring parks, whose only lidar predates their stands (section 3).
- Retractable roofs are assumed open.
13. Reproducing it
Inputs that are not in the repository live outside it (on the machine that built the data, in ~/.cache/shademap/): the MLB snapshot, a clone of the vendor repository at dec934b, and the lidar caches. Software: Node 22, Python 3.13 with numpy 2.2, laspy 2.7 (lazrs backend) and pyproj 3.8; Pillow for the figures.
# The MLB snapshot and the vendor clone
mkdir -p ~/.cache/shademap/inputs
export SHADEMAP_SNAPSHOT=~/.cache/shademap/inputs/teams-2026-10-01.json
export SHADEMAP_VENDOR=~/.cache/shademap/inputs/ballpark-shadow-geometry
curl -o $SHADEMAP_SNAPSHOT 'https://statsapi.mlb.com/api/v1/teams?sportId=1&hydrate=venue(location,fieldInfo,timezone),springVenue(location,fieldInfo,timezone)'
git clone https://github.com/apelt001/ballpark-shadow-geometry $SHADEMAP_VENDOR
git -C $SHADEMAP_VENDOR checkout dec934ba48b4fdc2f01ac18c4495610e9595e784

# Spring park lidar (about 45 min of downloads), then the measurement (about 5 min;
# it reads the published fence distances from the snapshot)
python scripts/shademap/spring_lidar_fetch.py --cache ~/.cache/shademap/spring/lidar
python scripts/shademap/spring_lidar.py --cache ~/.cache/shademap/spring/lidar --snapshot $SHADEMAP_SNAPSHOT

# Park data from the snapshot, the vendor clone and the two lidar files
node scripts/shademap/build_parks.mjs --snapshot $SHADEMAP_SNAPSHOT --vendor $SHADEMAP_VENDOR

# The wall check, then the figures on this page
python scripts/shademap/wall_check.py --cache ~/.cache/shademap/spring/lidar
python scripts/shademap/spring_figures.py --cache ~/.cache/shademap/spring/lidar
node scripts/shademap/method_figures.mjs

# Tests, including a byte-for-byte rebuild of parks.json and rims.json, which runs only
# when the two inputs above are present (the variables, or those default paths)
npm test
The measurement is deterministic: re-running it reproduces spring-lidar.json byte for byte, and the test suite rebuilds parks.json and rims.json byte for byte from the pinned inputs when they are present; without them that one test reports itself skipped rather than failing. A fresh API call can drift from the 2026-10-01 snapshot over time (a renamed park, a new fence distance), and then the rebuild differs where the API did; the snapshot date is recorded in parks.json.
14. Sources and licenses
- Rim profiles, home plates and centre-field bearings at 21 MLB parks, and the methods ported for the other twenty: Adrien Peltzer, ballpark-shadow-geometry, commit dec934b, data CC BY 4.0, code MIT.
- Lidar: USGS 3D Elevation Program (3DEP), public domain.
- Parks, time zones, roofs, fences, clubs and the schedule: MLB Stats API. Copyright 2026 MLB Advanced Media, L.P.
- Sun: NOAA Solar Calculator.
- Stadium outlines used to place the spring park download boxes: © OpenStreetMap contributors, ODbL.
I built the Shade Map pairing with Claude Code. The code, the data and these figures are in the site's repository under public/shademap/ and scripts/shademap/.