Gemini 4 Argon in Waterline
Six things it does here that weren't possible last week.
Act 1 · It's already here
The El Niño Kelvin wave is already in the tide gauge.
A Kelvin wave is a pulse of raised sea level that El Niño sends along the equator and up our coast. You can see it at the Golden Gate gauge: every day this October the Bay has run higher than predicted, and by much more than last year.
This isn't one event. More waves are coming.
Expected pulses: oceanographer Dillon Amaya (NC State), as reported by NPR and ABC7. King tides: NOAA predictions. Gauge peak: measured.
Act 2 · The resident
Christmas Eve, 10:37 AM, at the Ferry Building.
The year's highest predicted tide lands on Christmas Eve morning. Stack this winter's conditions on top of it, layer by layer, on the measured shape of the waterfront: 661,599 lidar points from the USGS 2023 survey.
What the resident gets
High water near the Ferry Building, Thu Dec 24, 9:30–11:45 AM. Expect water 2 ft below the promenade; waves may splash over. Avoid the seawall edge.
Marea alta cerca del Ferry Building, jue 24 dic. El agua llegará a 2 pies del paseo; las olas pueden saltar. Aléjese del borde del malecón.
Hatched means assumed. In the realistic case still water stays below the promenade; waves on top of it are what flooded the Embarcadero in June 2026, and they aren't modeled.
Act 3 · The proof
We've seen this storm before. New Year's Eve 2022.
5.46 inches fell downtown, nearly a 100-year, 24-hour storm. In the Mission, 17 people called 311 to report flooding within 600 m of 17th & Folsom. We gave Gemini 4 Argon that storm and those reports, not a model, and it rewrote its flood model until the two agreed.
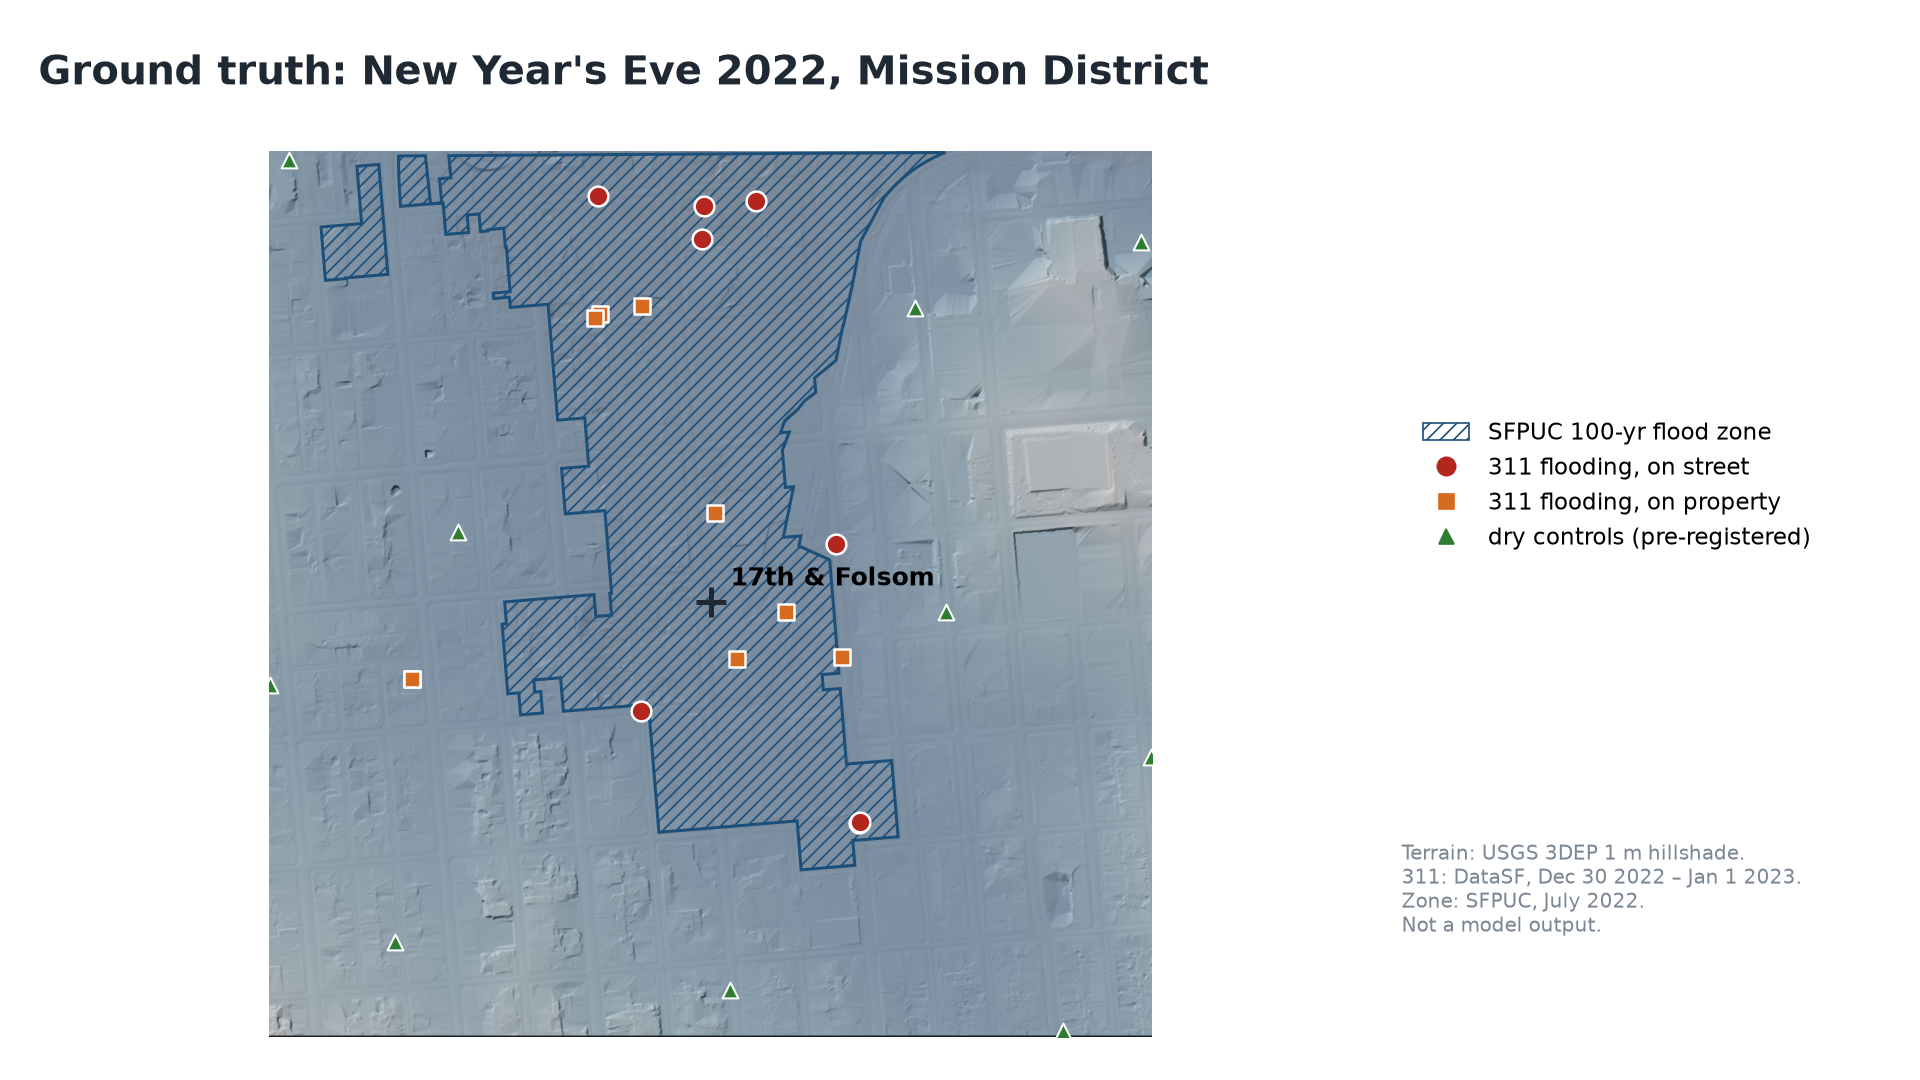
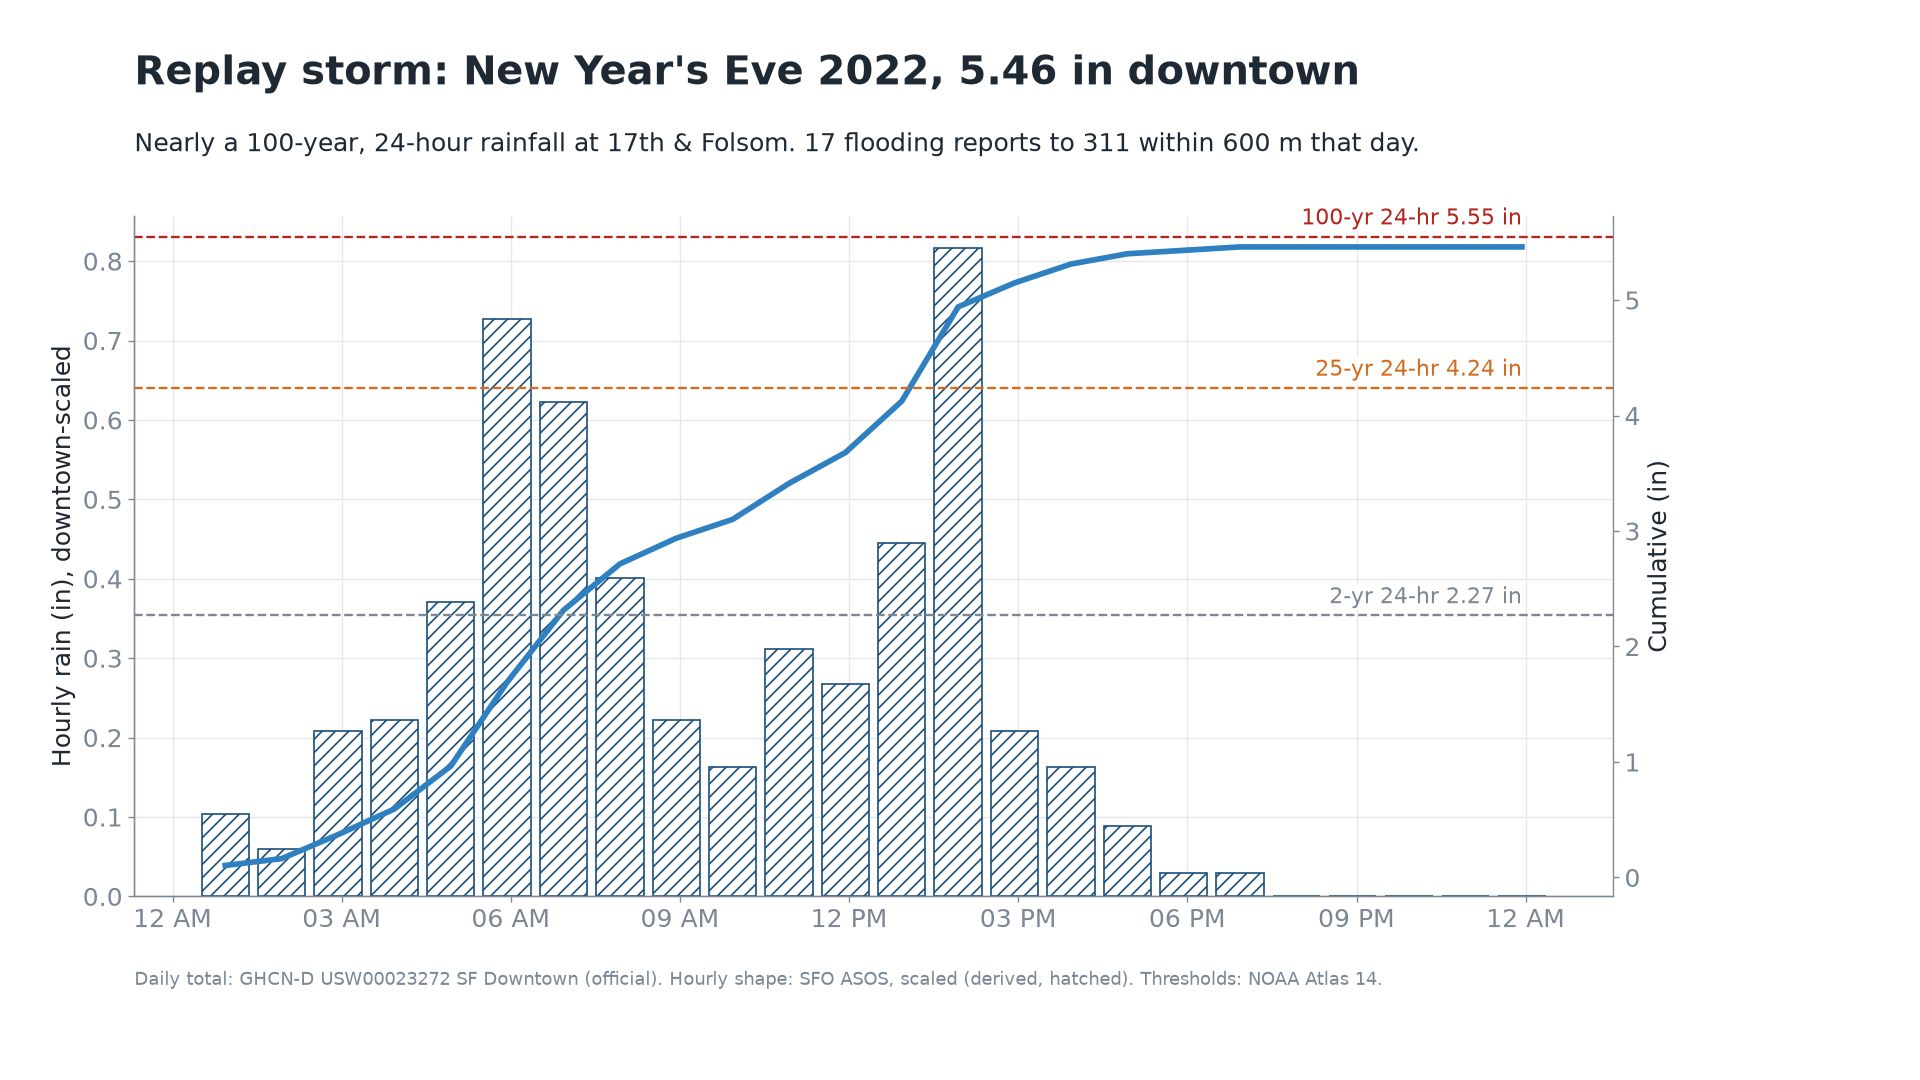
Scores are computed live on Sun Oct 25 and filled in here.
That night, in their own photos
Eight people attached photos to their 311 reports. Gemini reads each one, measuring the water against curbs, tires and doorsteps, and that becomes a depth to check the model against.
Photos: SF 311 public records (DataSF), Dec 31 2022 – Jan 1 2023. Plates blurred; locations shown to the street.
Act 4 · The city
A block-by-block timeline, drafted before the crews are called.
A team of Gemini managed agents re-runs every forecast cycle. Each one reaches data through a single MCP server, so every number carries its source. The coordinator turns the stack into a timeline against NOAA's flood thresholds and drafts the brief. A person decides.
Act 5 · The Storm Desk
Seventy-two hours before the storm, the agent goes to work.
A Gemini managed agent runs the city's flood prep end to end: it spots the risk, ranks the drains, drafts notices to the people who adopted them, writes work orders for crews, stages sites, re-plans when the forecast moves, and reviews its own run afterwards. A person approves every message that leaves the building.
Act 6 · Before the storm
Twelve drains matter most. A robot finds out which ones are blocked.
Clogged grates turn ordinary storms into street floods. San Francisco has more than 25,000 drains and crews deep-clean 5,000 to 9,000 a year. Waterline ranks the 468 real city drains around 17th & Folsom by how much water reaches each grate. A rover scouts the top twelve, Gemini reads each photo, and volunteers get a list before the rain.
Drains: SFPUC, the Adopt-a-Drain dataset. Ranking: water reaching each grate on the lidar terrain, each drain intercepting what reaches it. Red: 311 flooding reports, Dec 31 2022.
Grate condition comes from photos taken on the drain walk; Gemini classifies each as clear, partly blocked or blocked on Sun Oct 25.
Agents trace runoff over the lidar terrain to each of the city's drains and rank them.
A rover or a volunteer's phone photographs the top grates. Gemini labels each one.
The coordinator sends the blocked ones to Adopt-a-Drain volunteers and Public Works, with a deadline before the rain.
The hydraulics agent re-runs with those drains cleared, and the city sees how much ponding it avoided.
Act 7 · The whole city
Every drain and every low spot in San Francisco, ranked before Christmas.
The same pipeline ran citywide on the USGS lidar: 23,835 drains ranked, the street low spots where water collects first, and the city's 311 flooding history. Tap anywhere on the map to see that block.
Pick a block
Drill down · lidar
Fill a low spot and watch where the water goes.
Elevation-only fill from the lowest lidar ground point near the centre: no pipes, no rain timing. It shows the shape of the bowl, not a forecast.
Waterline
Strong El Niño. Street level. This winter.
From the tide gauge to your block to the drain on your corner: prediction, proof and prevention, run by Gemini 4 Argon managed agents.